← Back to Publications | Home
Notes
This is the first in-vivo animal experiment out of the Keinath Keinath Lab.
Really proud of this work.
Environmental representations in mouse hippocampal CA1 reflect the predictive structure of navigation
Sergio A. Pecirno$^1$ & Alexandra T. Keinath$^1$ | Cell Press Current Bio | December, 2025 | DOI | PDF
$^1$ Department of Psychology, University of Illinois at Chicago, Chicago, IL, USA
* The Arxiv version of this manuscript is available as: The predictive structure of navigation determines mouse CA1 representational structure
in a multicompartment environment , and can be found here.
Abstract
Predictive theories of cognitive mapping propose that these representations encode the predictive
relationships among contents as experienced by the navigator. One hallmark of these theories is
that representational structure in complex environments can be predicted from the behavioral
history of the navigator. Here, we image neural activity in hippocampal CA1 as initially naïve mice
repeatedly navigate a multicompartment environment to test whether representational structure
in this subregion is consistent with these predictions. We find that different mice instantiate
different patterns of remapping across identically shaped compartments. Within mouse,
compartments with more similar predictive navigational histories on a particular spatiotemporal
scale are represented more similarly, accounting for these individual differences. Manipulating
navigational options induces reorganization of the CA1 structure which specifically resembles the
new predictive navigational structure on this timescale. Through computational modeling we show
that a combination of predictive encoding and geometrically structured inputs can uniquely
account for this pattern of results. Together, these results demonstrate that the predictive structure
of navigation is one important determinant of CA1 representations in complex environments,
consistent with predictive theories of cognitive mapping.
Introduction
In order to survive and thrive, organisms from mice to humans rely on mnemonic representations of the external world and their relationships to it [1].
Referred to as cognitive maps, these representations are instantiated by the coordinated activity of spatially tuned neural populations in the hippocampus and
neighboring cortices [2,3]. Cognitive maps are often thought to represent the layout of the world [4,5], motivated in part by the plethora of cells tuned to geometric
features locations, distances, and angles found throughout the hippocampal formation and neighboring cortices [2,6,7,8,9,10,
11,12,13,14,15,16,17,18,19,20].
Yet recent theories instead posit that cognitive maps represent the predictive relationships among their contents as experienced by the navigator [21,22,23,24], with geometrically structured inputs
(among others) providing a scaffold upon which predictive structure can be learned [3,25,26,27].
Because the layout of an environment often determines the predictive relationships that the navigator experiences, and because modifying navigation often entails modifying the
layout of the world, it can be difficult to disentangle contributions of the two. Nevertheless, there are fundamental differences between predictive and world-centered theories.
One hallmark of predictive theories is that the way in which a navigator explores a space is a critical determinant of the structure of their cognitive map [21]. If navigators
explore the same space differently, then their cognitive maps should be structured differently, in a way which can be predicted from their navigational patterns.
These differences should manifest across levels of explanation from neural instantiations through behavior, from the activity of single cells through the representational
geometry of neural populations.
Motivated in part by these predictions, a growing body of work is characterizing the behavioral determinants of neural activity in the hippocampus and functionally related
cortices [8,15,28,29,30,31,32,
33,34,35,36]. In many cases this work has demonstrated behavioral modulation of activity at the
level of single cells and moment-to-moment population trajectories which can be consistent with predictive theories [15,31,32,
35,36,37].
Beyond these, predictive theories also make concrete claims about how behavior should determine the representational similarity among locations in complex environments consisting of multiple subspaces [21].
Within the hippocampus, representational similarity is reflected in the degree of decorrelation in the population response within or between spaces, known as remapping.
Prior work has demonstrated that remapping depends on the features shared between spaces [38,39,40,
41,42], past experience with those spaces [43,44,45,46,47], and the
broader reference frames in which those spaces are situated [45]. Individual differences in the degree of remapping within the same paradigm have been observed [48],
suggesting that remapping is not determined by world features and prior experience alone and can vary between navigators. Each of these characteristics might be
understood within a predictive framework, as resulting from changes to input features and/or the experience-dependent encoding of predictive structure.
Yet predictive theories make even more specific predictions about patterns of hippocampal remapping in complex spaces [21]. So far, empirical tests have not conformed to these predictions [49],
calling into question whether the structure of hippocampal representations in these spaces can be understood through this lens. Notably, this previous test included multiple complexities out
such as extensive prior experience in the environment as well as short-term changes to navigational options and the reward landscape which make deriving concrete predictions from a predictive
framework more challenging. Here, we test whether patterns of hippocampal remapping in complex spaces conform to a predictive framework in a simpler paradigm which avoids some of these complexities.
Specifically, we characterize population activity in hippocampal CA1 as initially naïve mice repeatedly explore four identically shaped connected compartments in the absence of reward. To do so with
high fidelity and across long timescales, we rely on chronic miniscope imaging. We test three hypotheses. If CA1 representational structure conforms to a predictive framework, then (i) mice that
navigate differently should exhibit different patterns of remapping across compartments, (ii) within mouse, compartments with more similar predictive navigational histories should be represented more
similarly, and (iii) changing the navigational trajectory of a mouse should change its representational structure to better resemble the new predictive structure. Evidence against any of these
hypotheses would support an alternative theory.
In all cases our data support the predictive claims. That is, we find that different mice exhibit different patterns of remapping across compartments. These patterns coincide with the similarity of
predictive navigational histories on a seconds-long timescale, modestly overweighting early experience. Manipulating the navigational trajectory of the mouse induces a reorganization of the CA1
representational structure which specifically resembles the new predictive structure on this timescale, with a reversion to the previous pattern when relaxed. Leveraging computational modeling,
we show that key results can be accounted for by a combination of predictive encoding operating on geometrically structured inputs; neither predictive encoding nor geometrically structured inputs
were on their own sufficient to reproduce our pattern of results. Together, these results demonstrate that the behavioral history of the navigator is one important determinant of hippocampal
representations in complex environments, consistent with predictive theories of cognitive mapping.
Results
Characterizing CA1 representational structure in a multicompartment environment
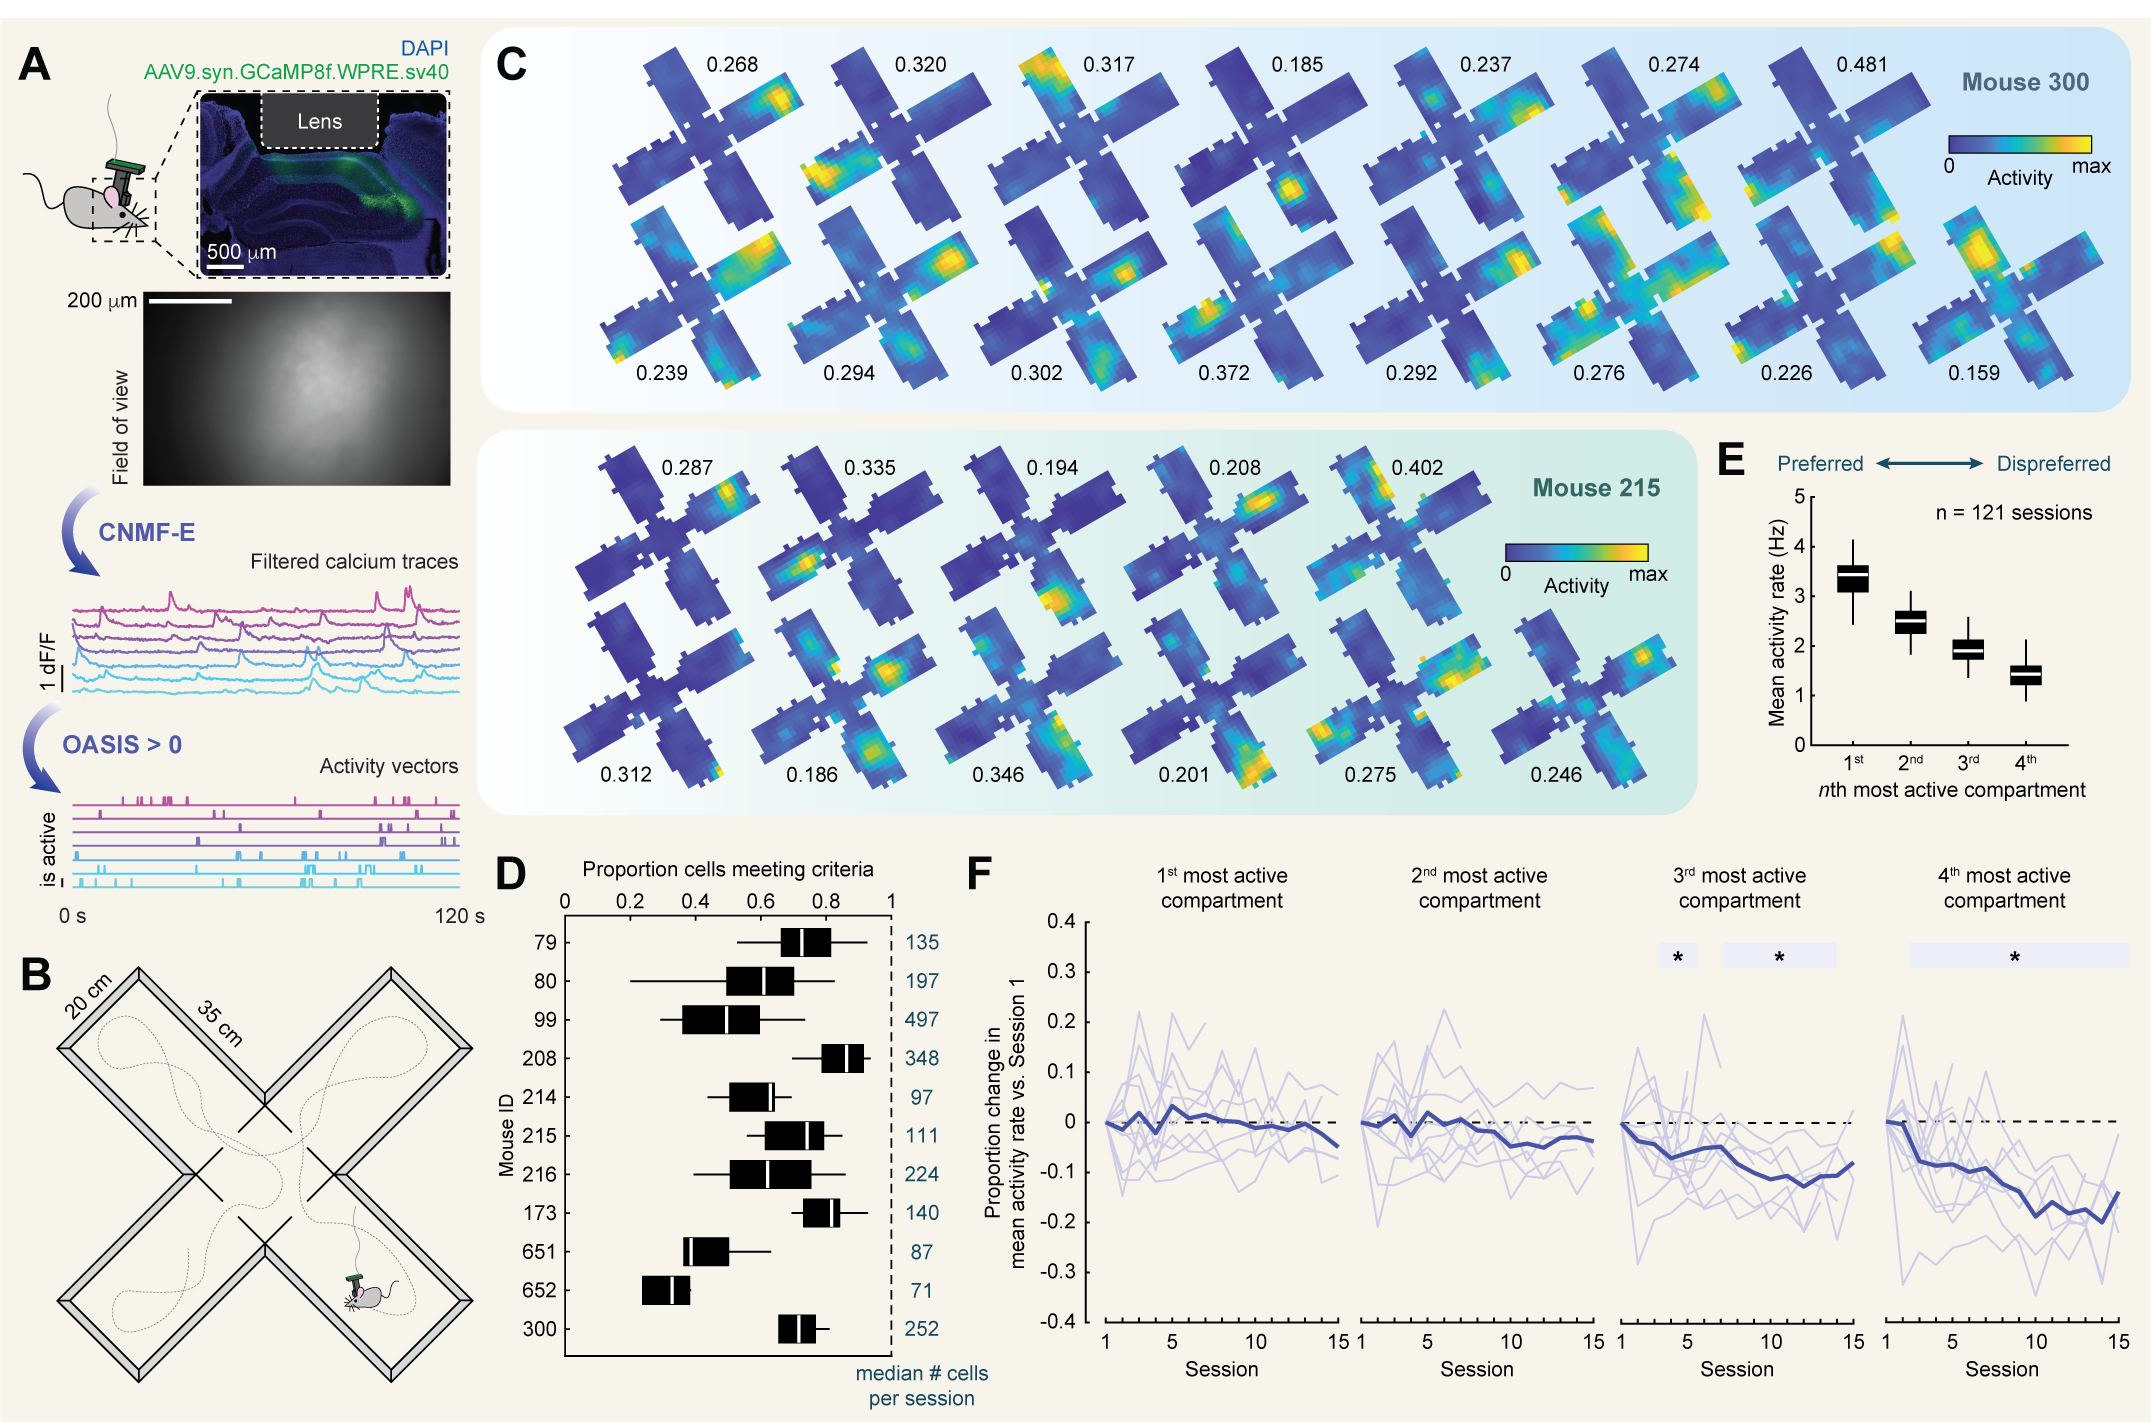
We recorded daily from hippocampal CA1 via miniscope calcium imaging [Fig. 1a] as initially naïve mice (n = 11; 6 male) navigated a radial multicompartment environment.
This environment consisted of four 20 cm by 35 cm rectangular compartments connected by a central chamber [Fig. 1b]. Each session lasted either 30 or 40 min depending
on imaging signal strength to maximize the amount of data while minimizing the impact of photobleaching. Both miniscope and behavioral data were simultaneously
recorded at a sampling rate of 30 Hz, and behavioral data were linearly interpolated for each imaging frame on the basis of system clock timestamps. In the first
phase of the experiment, initially naïve mice navigated this environment freely for between five and fifteen sessions (n = 121 sessions total). We refer to these
sessions as $Free^1$. The environment was not baited with rewards during any phase of the experiment.
For each session, imaging data were first motion corrected [50]. Next, cells were segmented, and their calcium traces were extracted via constrained nonnegative matrix
factorization (CNMFE; [Fig. 1a]) [51,52]. For each trace, the likelihood of spiking events giving rise to that trace were inferred through a second-order autoregressive
deconvolution algorithm [53] [Fig. 1a]. This nonnegative vector was then binarized such that any frame with a nonzero likelihood was treated as active (i.e. 1),
otherwise it was treated as not active (i.e. 0). All further analysis was conducted on this binary activity vector.
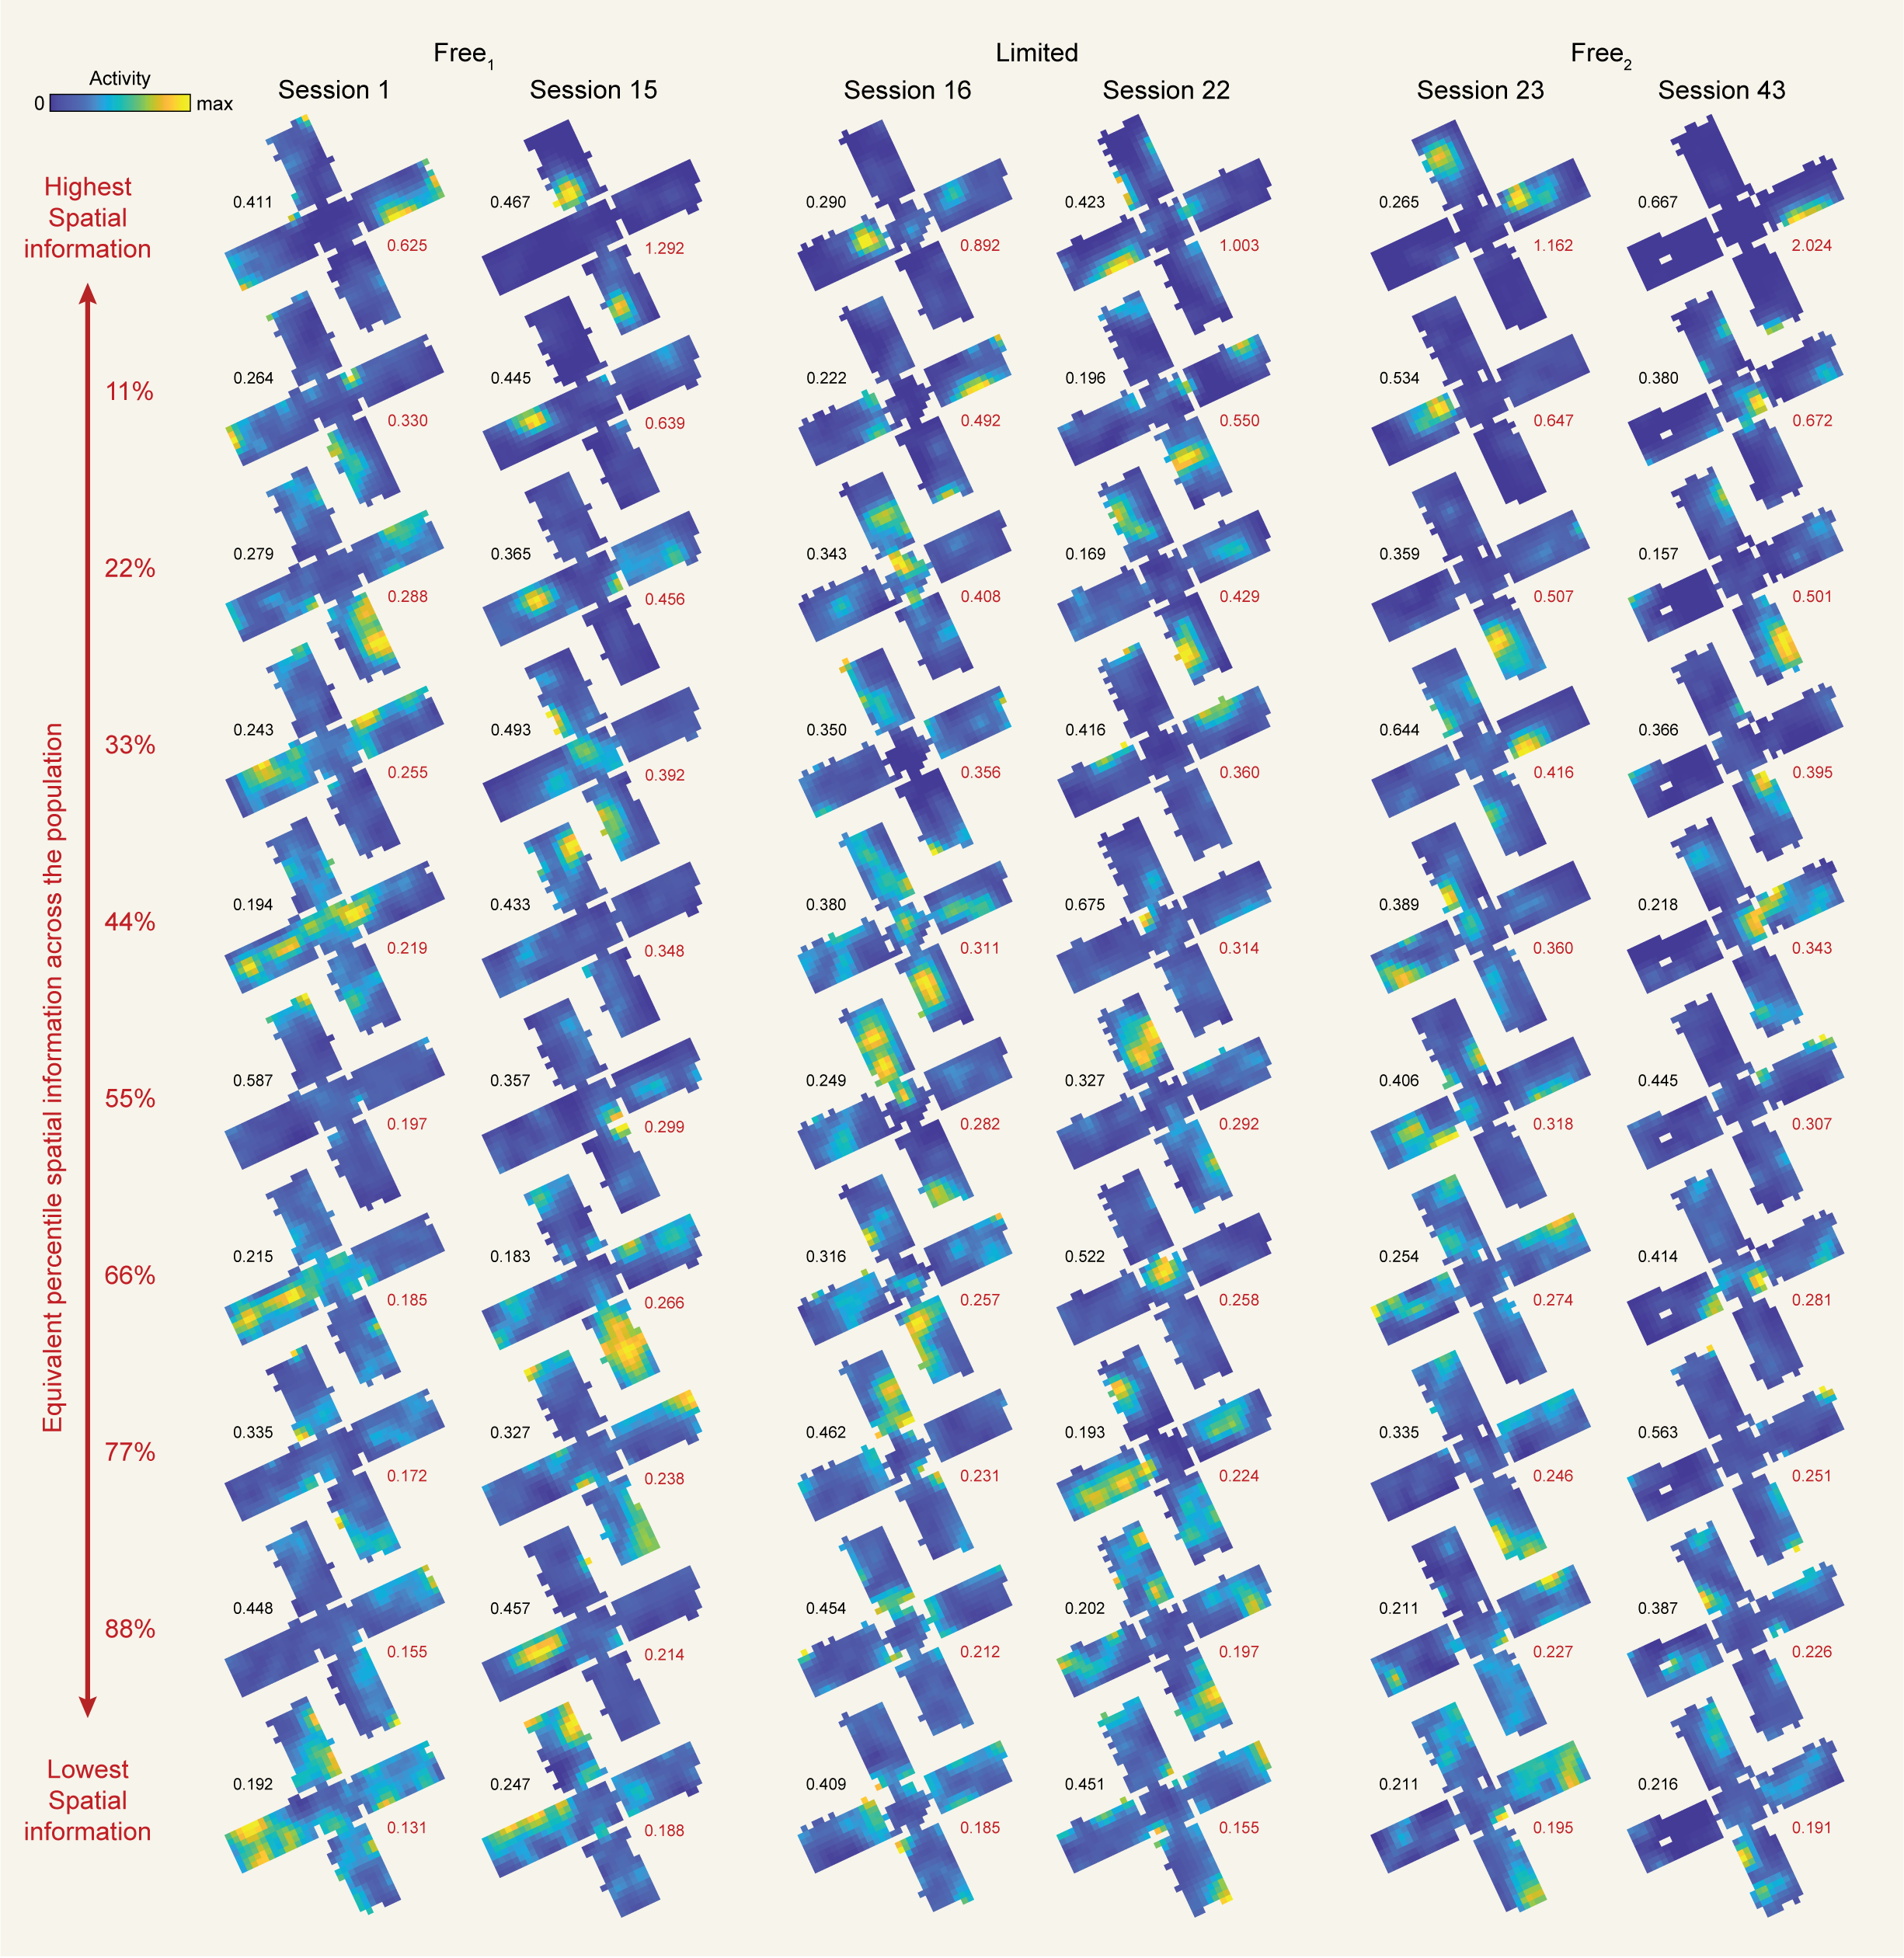
To characterize the extent to which spatial location modulated the activity of each cell, we computed a rate map for each cell summarizing the mean activity of that
cell as a function of location within the environment [Fig. 1c]. Next, we computed the split-half stability and spatial information content of this rate map.
To assess the significance of these measures, we compared these values to surrogate distributions computed by circularly shifting the activity vector relative to
the position vector 1000 times. Cells with split-half stability and spatial information content exceeding the 95th percentiles of both distributions were considered
spatially tuned and included in further analysis, though relaxing these criteria did not qualitatively change our results. Generally, the majority of cells met
these criteria [Fig. 1d], with lower proportions of cells meeting criteria in mice with shorter recording durations and qualitatively weaker signal.
Prior work in multicompartment environments has demonstrated that individual CA1 cells tend to be active in multiple compartments [54,55],
making comparisons between compartments meaningful. We confirmed this was the case in our data. To do so, for each cell we computed its mean
activity rate in each compartment and sorted these from the most active to least active compartments. Across sessions, we found that mean activity
rates remained high in all compartments, with on average at least ~1 active frame per second even in dispreferred compartments [Fig. 1e].
The difference in activity rate between preferred and dispreferred compartments was approximately 3-fold. Interestingly, we also observed changes in
mean activity rates with experience in dispreferred (but not preferred) compartments [Fig. 1f]. Reflecting this, a linear mixed effects model of changes
in mean activity rates as a function of compartment and session number with mouse ID as a random factor revealed a significant interaction between compartment
and session ($F(3,396) = 3.84, p = 0.0099$). Neither main effects of compartment nor session number reached significance
($F(3,396) = 0.81, p = 0.4947$ and $F(1,396) = 0.21, p = 0.6515$, respectively). These results are consistent with the development of sparsity and/or sharpening of the spatial code across experience [56].
Different mice instantiate distinct and persistent patterns of remapping across identical compartments
Predictive theories claim that CA1 representational structure should be determined at least in part by the
predictive structure of one's navigational trajectory. If so, then we would expect mice in our paradigm to
instantiate different patterns of remapping between compartments insofar as they navigate with different
trajectories. While individual differences in representational structure might also be expected on many other
bases, evidence against such individual differences would challenge the predictive claim. On the other hand,
if the layout of the environment alone determines representational structure, then we might expect mice in our
paradigm to instantiate similar patterns of remapping. Such common structure might correspond to key geometric
features such as the distance between compartments or the relative orientations of the compartments [54,55].
To address these possibilities, we characterized the degree of remapping between compartments in our data using a
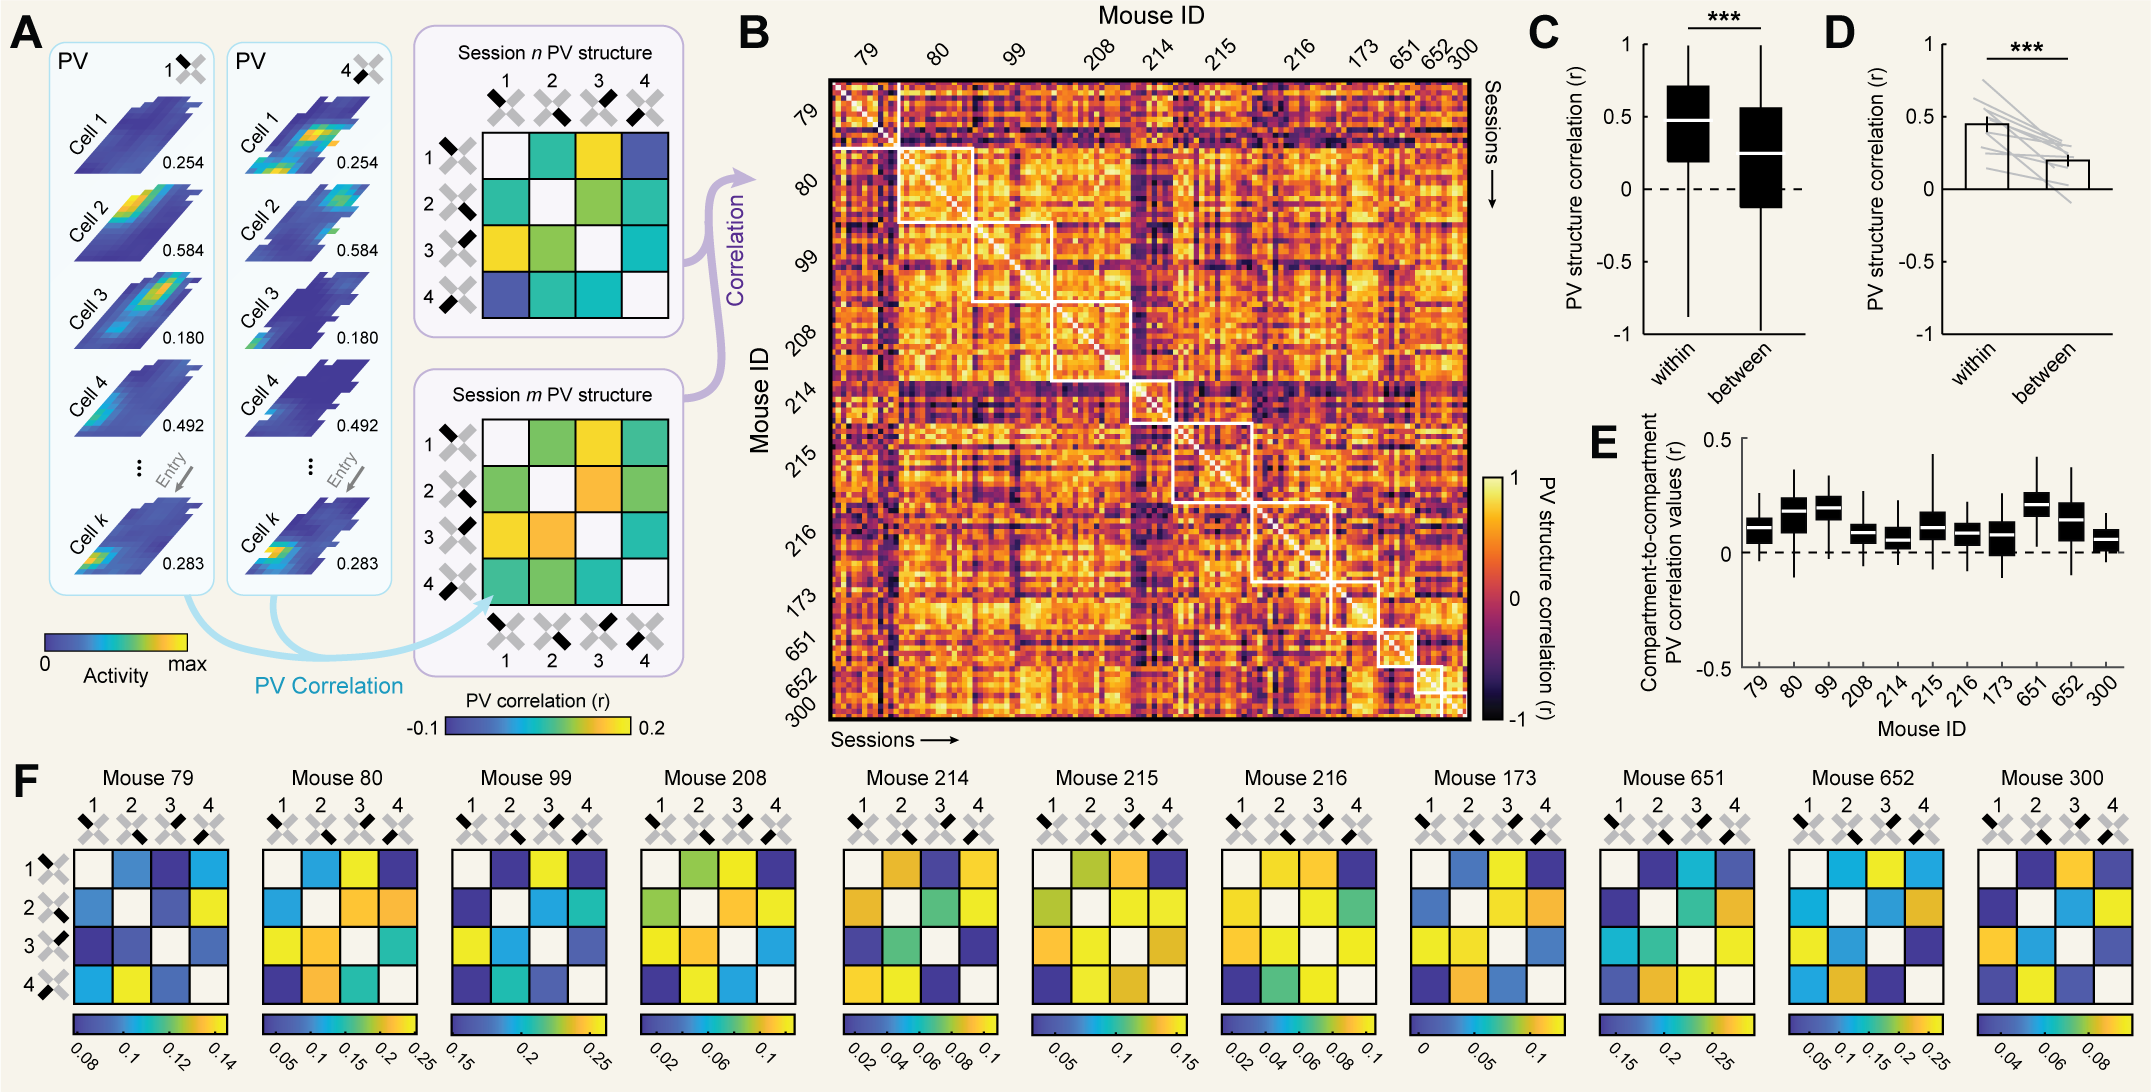
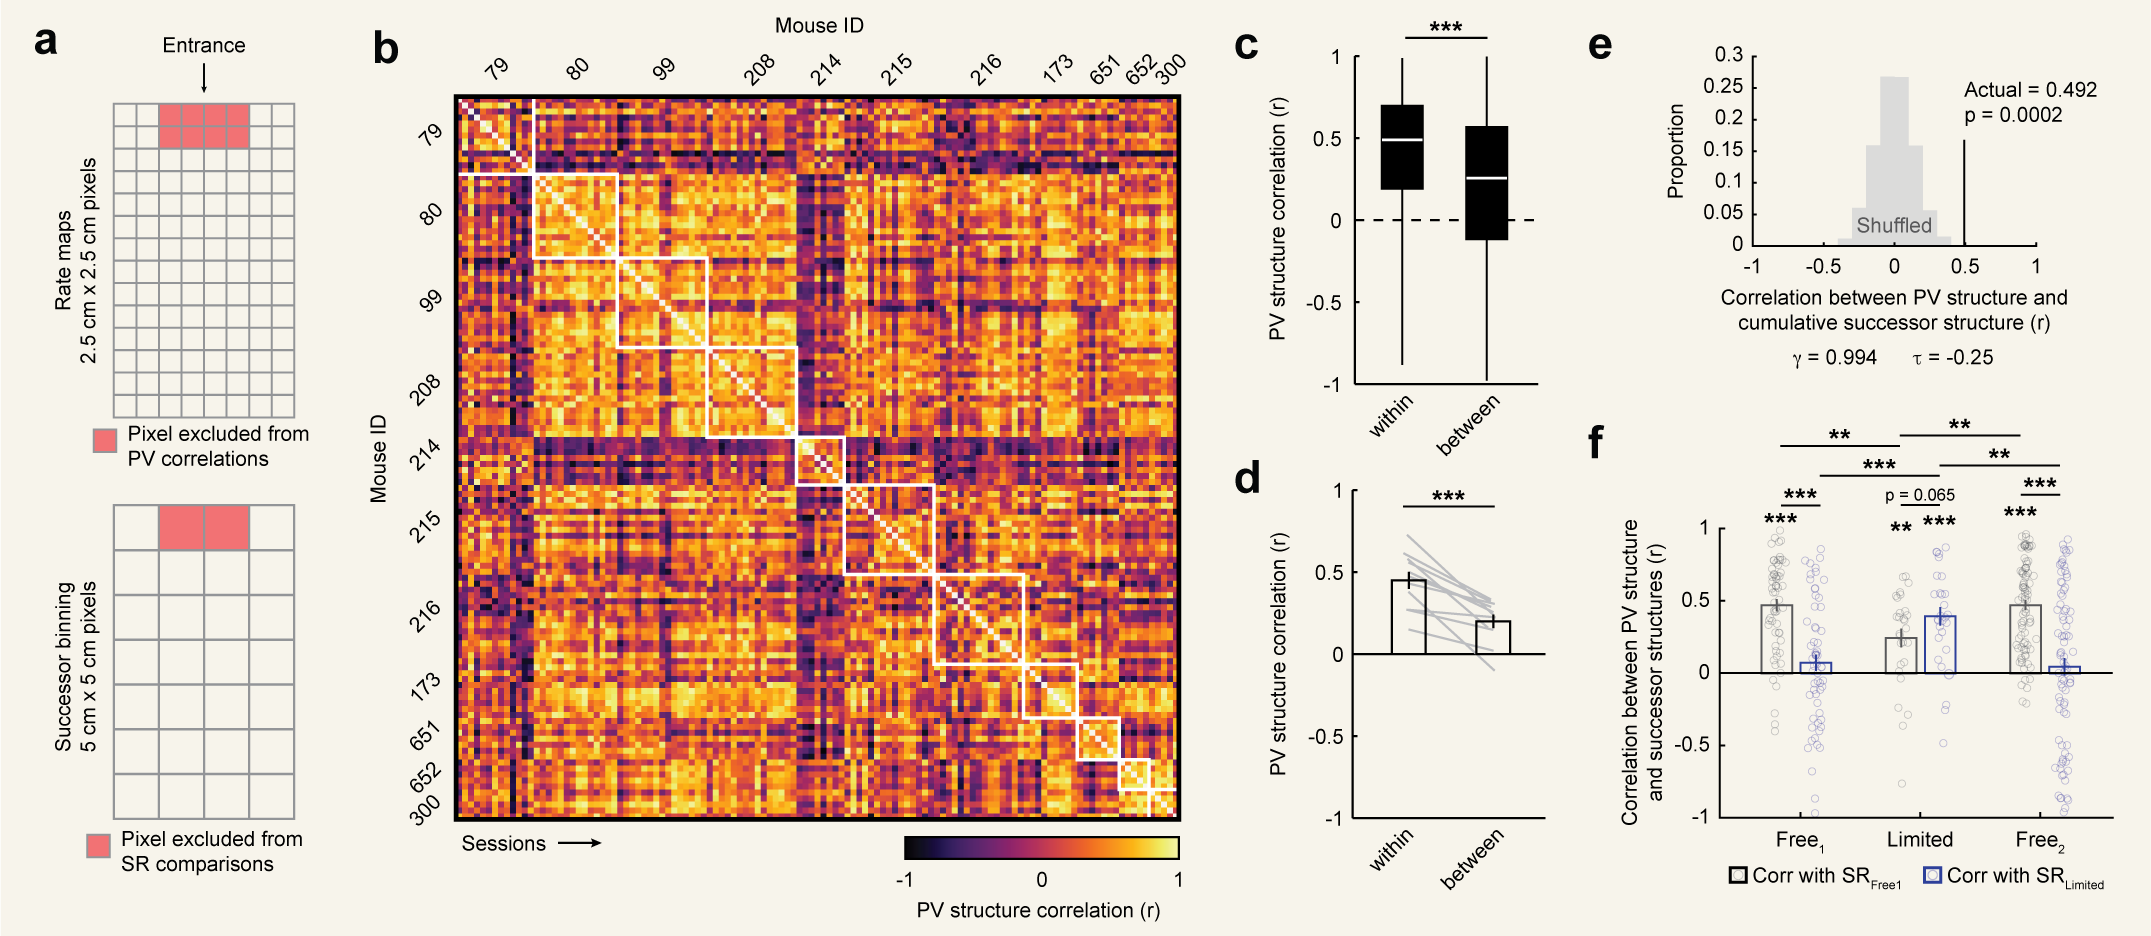
population vector approach. To this end, for each cell we first computed a separate rate map for each compartment [Fig. 2a].
Next, for each session we computed the population vector (PV) correlations between all pairwise comparisons of
compartment rate maps, aligned by their entryways and excluding unsampled pixels [Fig. 2a]. PV correlations summarize
the degree to which two spaces are represented similarly at the level of the neural population in a way that captures
changes in both firing rates and spatial tuning. Computing all pairwise PV correlations between compartments yields
a 4 x 4 matrix which we refer to as the PV structure [Fig. 2a]. Finally, we correlated PV structures between sessions
and compared correlations between different sessions from the same mice to correlations between sessions from different
mice [Fig. 2b].
Consistent with the predictive theory, comparisons of sessions from the same mouse resulted in significantly higher correlations than comparisons between mice
[Fig. 2C,D]. Moreover, despite the limited number of comparisons defining the PV structure (i.e. six pairwise comparisons between the four compartments), these differences were so reliable that a simple Euclidean distance-based classifier could correctly predict mouse identity well above chance (accuracy = 45.45%, chance = 9.09%, p = ~0; binomial test). This reliable structure was present even though PV correlation values between compartments were generally low in magnitude
[Fig. 2E], suggesting that even weak correlations in representational structure can be stable and informative [57]. Even averaging within mouse, PV structures varied
widely between mice and qualitatively did not come to resemble a consistent geometric feature of the compartmental layout (i.e. distance, entryway angle, long axis,
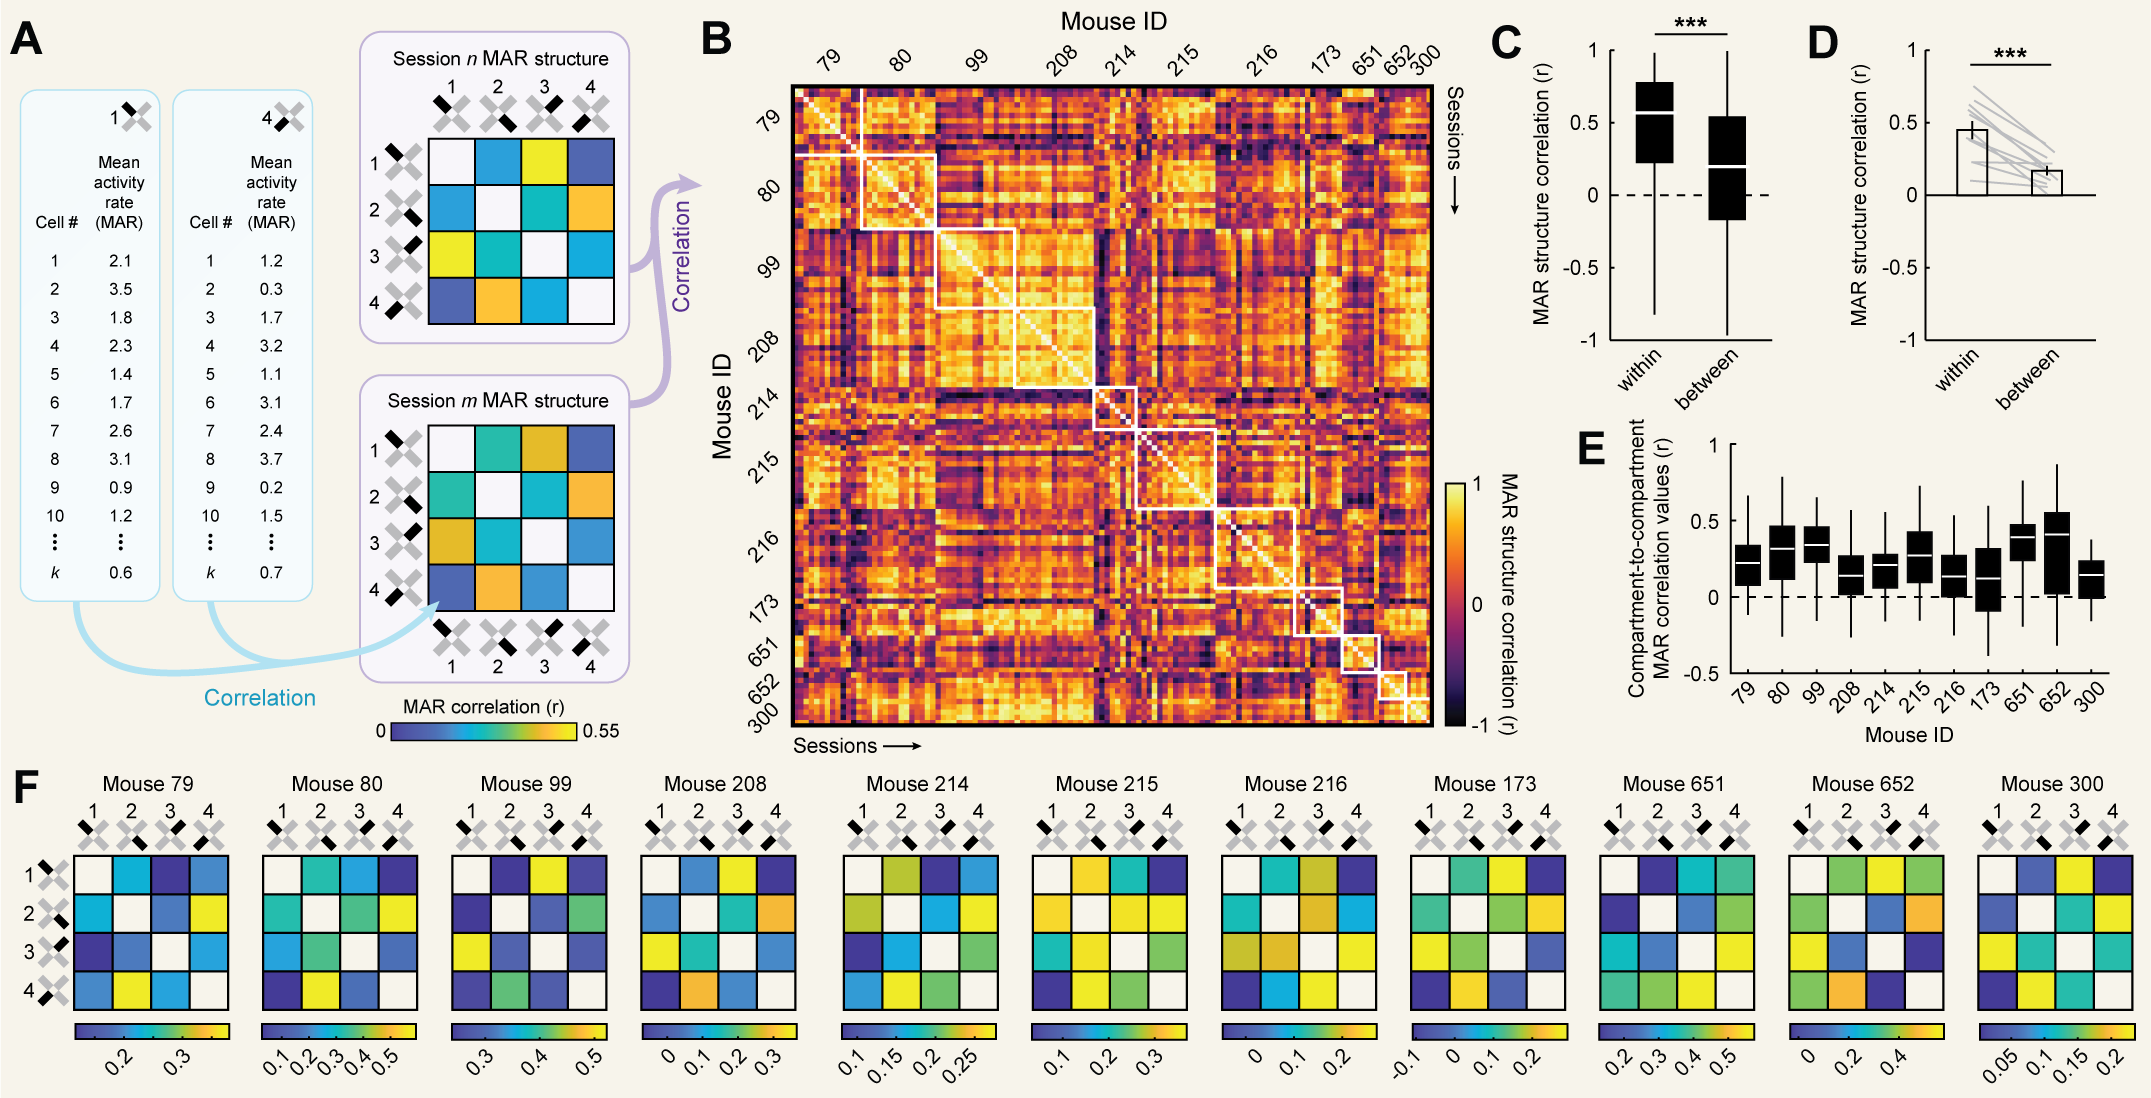
etc.; [Fig. 2F]). Similar results were observed when correlating mean activity rates as the measure of remapping [Fig. S1], indicating that our results are not
dependent upon the rate map-based assumptions underlying PV correlations. Mice also varied in the extent to which competing reference frames oriented repeating
place fields across compartments [Fig. S2]. Together, these results demonstrate that mice instantiate idiosyncratic patterns of remapping across compartments
in this multicompartment paradigm.
Idiosyncratic CA1 representational structure matches the predictive structure of navigation on a particular spatiotemporal scale
Our previous results demonstrate reliable individual differences in CA1 representational structure in mice navigating our multicompartment environment.
While these differences could arise from predictive cognitive mapping, individual differences are not on their own unique to this theory.
For example, a geometric theory might predict individual differences if navigators are attending to or naturally emphasize different features of the world.
Therefore, we next tested the more specific claim of predictive theories: that individual differences in CA1 representational structure arise due to
idiosyncratic navigational differences. If correct, then compartments with more similar predictive navigational structures should be represented more
similarly in CA1.
To test this possibility, we leveraged one formalization of predictive cognitive mapping, the successor representation21. At a high level, the successor
representation defines the behavioral determinants of hippocampal representational structure as the temporally discounted probabilities of transitioning
between locations within an environment. This is expressed as a successor matrix M such that [Eq. 1]:
$ M = \sum_{t=0}^{\infty} \gamma^{t} T^{t} = (I - \gamma T)^{-1}$
where $T^n$ is the $n$-step transition matrix capturing the probability of transitioning from one location to another after $n$ timesteps,
$\gamma$ is the temporal discount factor which determines how heavily transitions near in time versus far in time are discounted,
and $I$ is the identity matrix.
In our case, for a given session s we can compute the successor matrix $M_{s,k}$ separately for each compartment $k$. Correlating these matrices
between all pairwise comparisons of compartments yields a $4 \times 4$ matrix which we can compare to the PV structure for that session. If the
predictive claim is correct, then these matrices should be correlated. Importantly though, in our paradigm mice explored the environment
for multiple sessions, and it is not obvious whether navigation during every session should have an equal impact on CA1 representational
structure. While this is certainly a possibility, it is also possible that more recent behavior or early behavior has an exaggerated
impact on determining CA1 representational structure. The longitudinal nature of our recording paradigm allows us to test these possibilities.
To do so, for each session $s$ and compartment $k$ we computed a cumulative one-step transition matrix $C_{s,k}$ from all navigational data up to and
including that session such that [Eq. 2]:
$C_{s,k} = \left[ \sum_{i=1}^{s} e^{(\tau_i)} N_{i,k} \right]_{\oslash}$
where $N_{i,k}$ is the one-timestep transition count matrix for session $i$ and compartment $k$, $\tau$ determines the
exponential weight with which each session's transition counts contributes to the cumulative transition matrix,
$\Sigma$ denotes element-wise summation across sessions, and $\oslash$ denotes row-normalization such that each element is
divided by the sum of all elements in its row [Fig. 3A]. A negative value of $\tau$ will overweight early session
behavior. A positive value of $\tau$ will overweight more recent behavior. A $\tau$ of zero will equally weight behavior
from all sessions. Substituting $C_{s,k}$ for $T$ in equation [Eq. 1], we can compute the cumulative successor matrix
$M_{s,k}$ for each session $s$ and compartment $k$ such that [Eq. 3]:
$M_{s,k} = (I - \gamma C_{s,k})^{-1}$
Finally, we can correlate $M_{s,k}$ between all pairwise comparisons of compartments (excluding unsampled pixels), yielding the $4 \times 4$
matrix which we refer to as the cumulative successor structure [Fig. 3A]. This matrix summarizes the similarity in predictive navigational
structure between compartments dependent upon two parameters, $\gamma$ and $\tau$. These parameters determine the time horizon of the encoded predictive
structure and the weighting of cumulative experience, respectively.
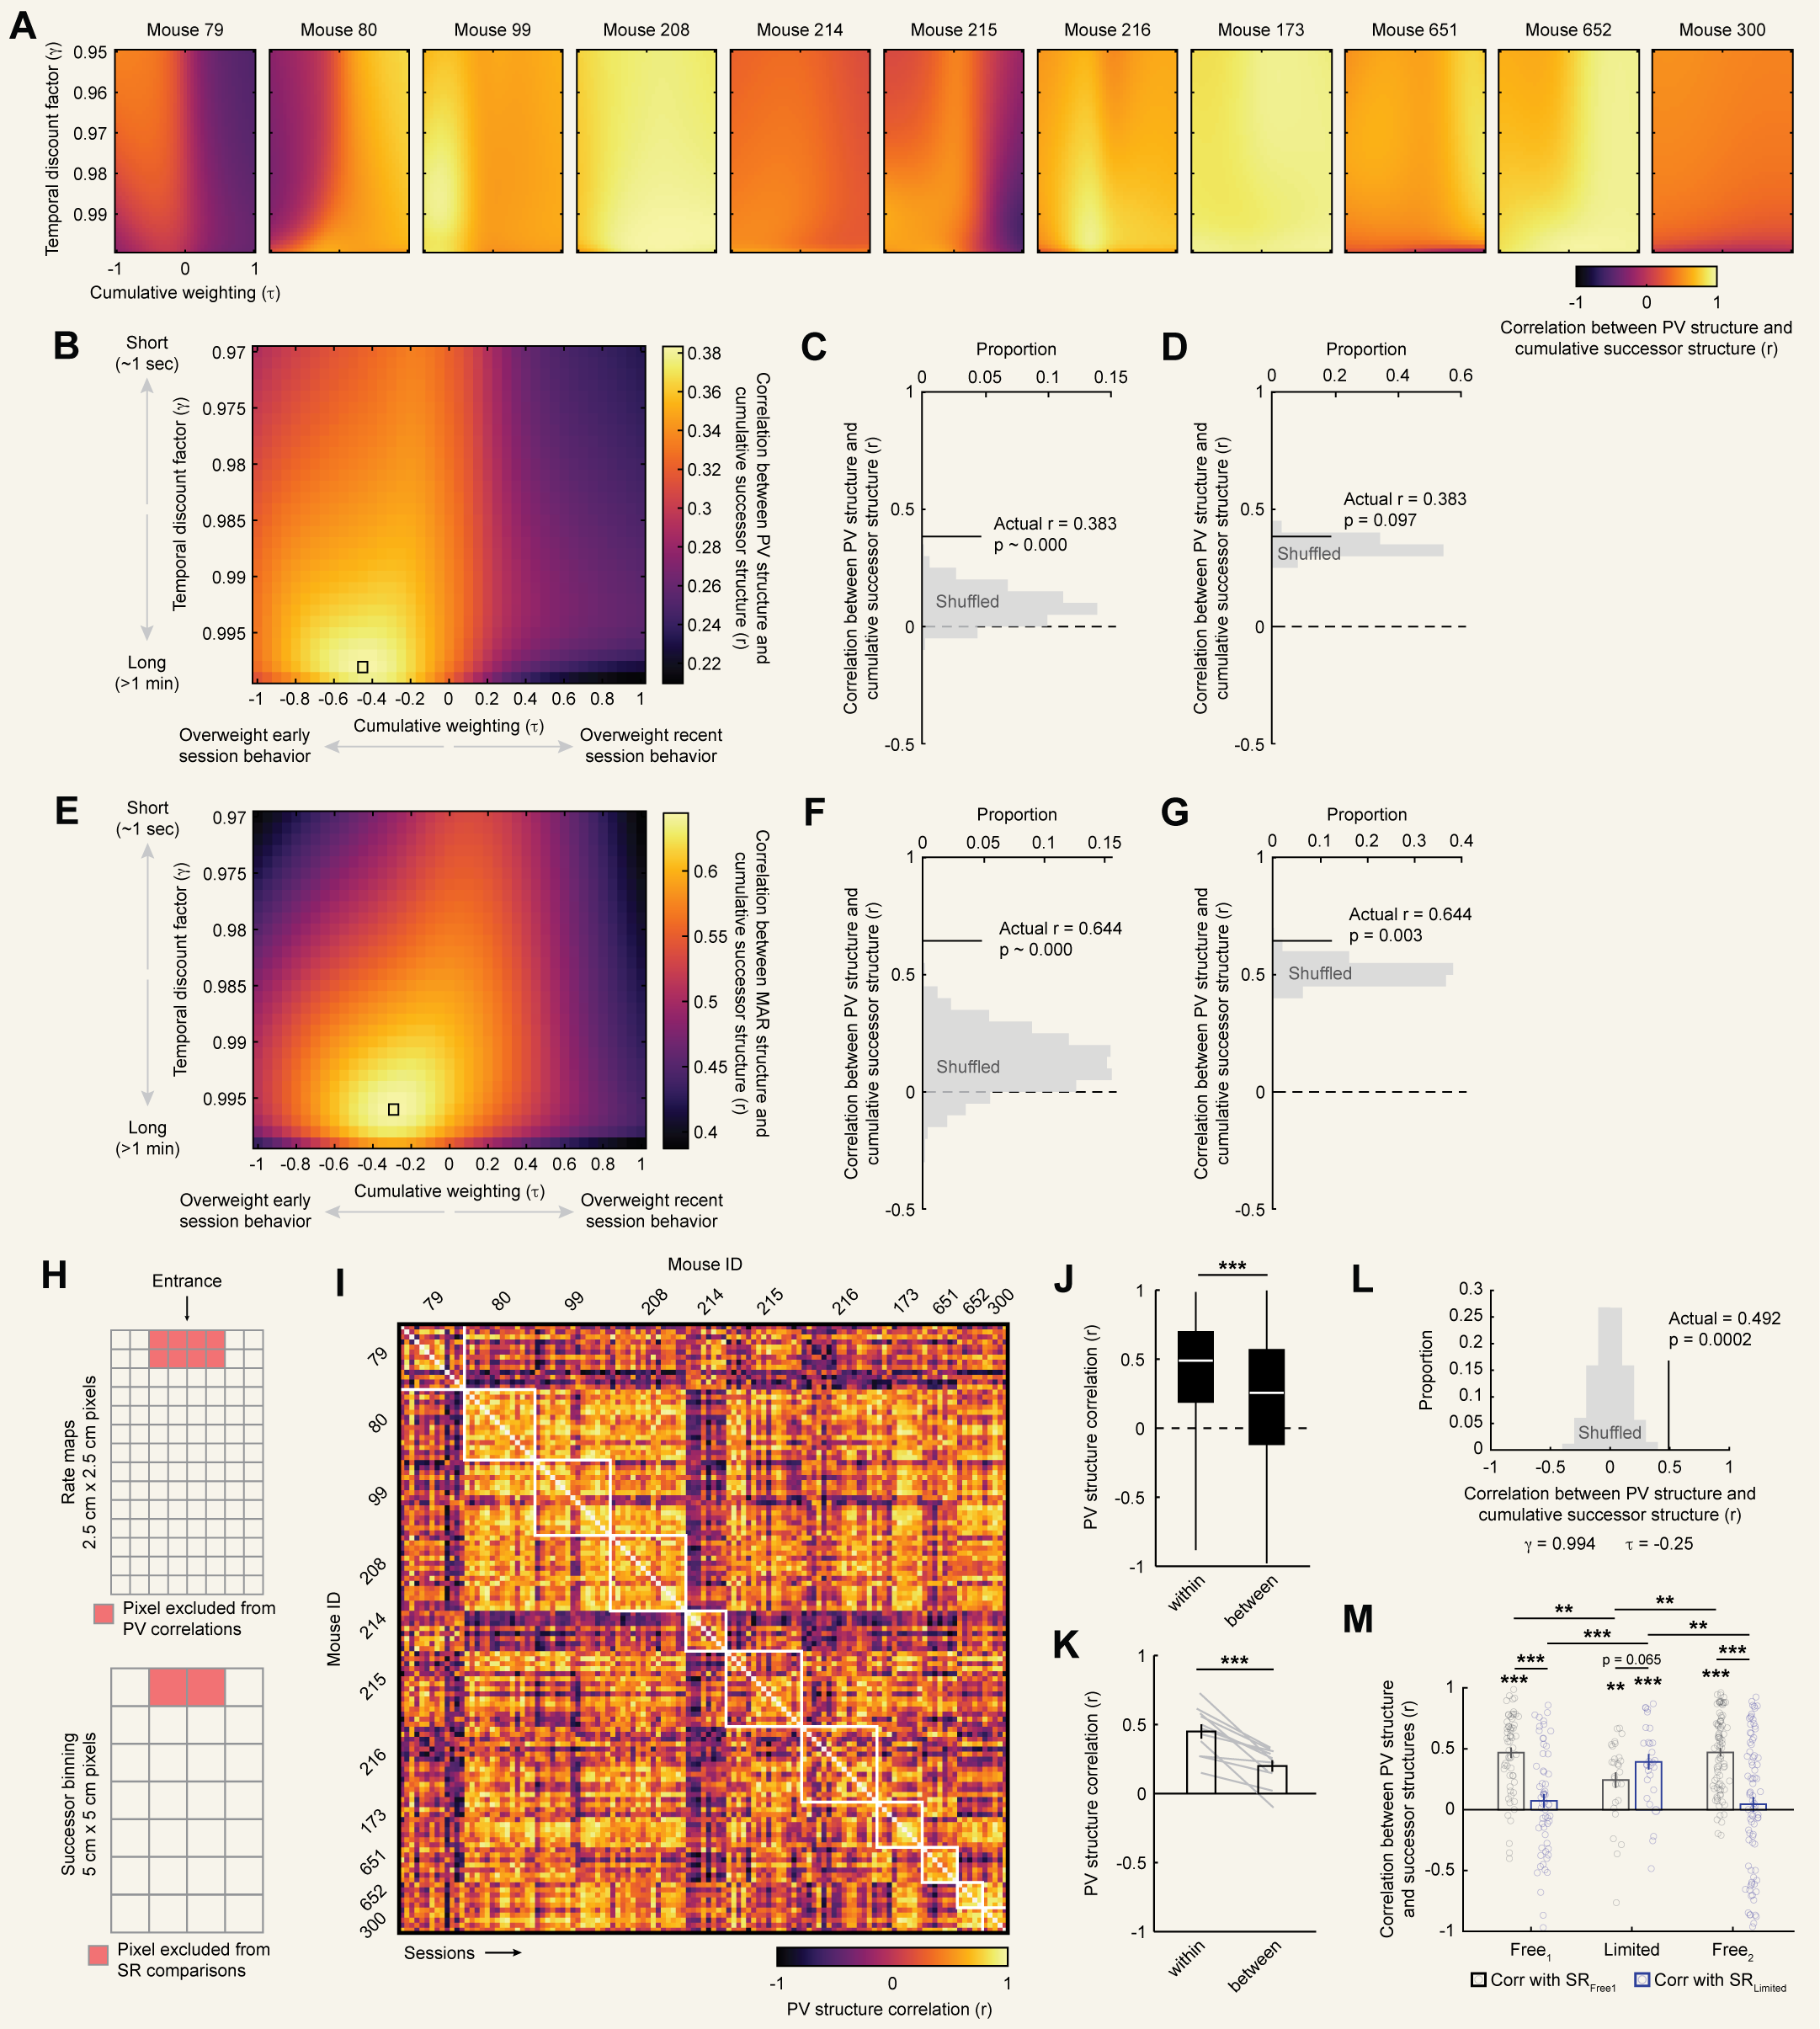
To determine whether cumulative successor structures match CA1 PV structures at any parameterization, we conducted a grid search where $\gamma$ and $\tau$ were varied and
the mean successor structure was correlated with the mean PV structure for each mouse. This analysis revealed that mean successor structures were highly
correlated with mean PV structures at a particular subset of parameterizations, with a maximum at $\gamma = 0.994$ and $\tau = -0.25$ [Fig. 3B,C]; [Fig. S3A].
These parameters correspond to a seconds-long timescale for encoding predictive structure, modestly overweighting early experience [Fig. 3D].
To assess the significance of the high correlation we observed at this parameterization (mean $r = 0.600$), we considered several controls.
First, we compared this value to the distribution we might expect from generic mouse behavior by randomly shuffling transition count matrices
(i.e. $N$ in [Eq. 2]) between compartments, sessions, and mice prior to computing cumulative successor structures. To account for the
selection of the maximizing parameterization from our grid search, we repeated our grid search for each shuffle and took the maximum correlation
for that shuffle. The true correlation exceeded this control (nonparametric $p \sim 0.000$, 1,000 shuffles; [Fig. 3E]). Next, we tested whether the specific
order of experience mattered by randomly shuffling transition count matrices across sessions separately for each mouse before computing cumulative
successor structures and choosing the maximum correlation across the grid search for each shuffle. Again, the true correlation exceeded this control
(nonparametric $p = 0.011$, 1,000 shuffles; [Fig. 3F]). Repeating these analyses but treating individual sessions as the unit of analysis rather than
individual mice yielded similar results [Fig. S3]. Substituting mean activity rates as the measure of remapping also yielded similar results [Fig. S3],
indicating that the concordance between predictive structure and degree of remapping we observe is not dependent upon the rate map-based assumptions
inherent in PV correlations. We note that positive values of $\tau$ which overweight current session experience yielded numerically weaker correlations between
successor structures and PV structures. This provides additional evidence that the concordance we observe between these structures at maximizing
parameterizations is not due to low-level within-session confounds. Together, these results demonstrate that compartments with more similar predictive
navigational structures on a particular spatiotemporal scale are represented more similarly in CA1, consistent with a predictive theory of cognitive mapping.
To gain more insight into how predictive navigational structure varied within and between mice on this critical timescale ($\gamma = 0.994$), we next computed
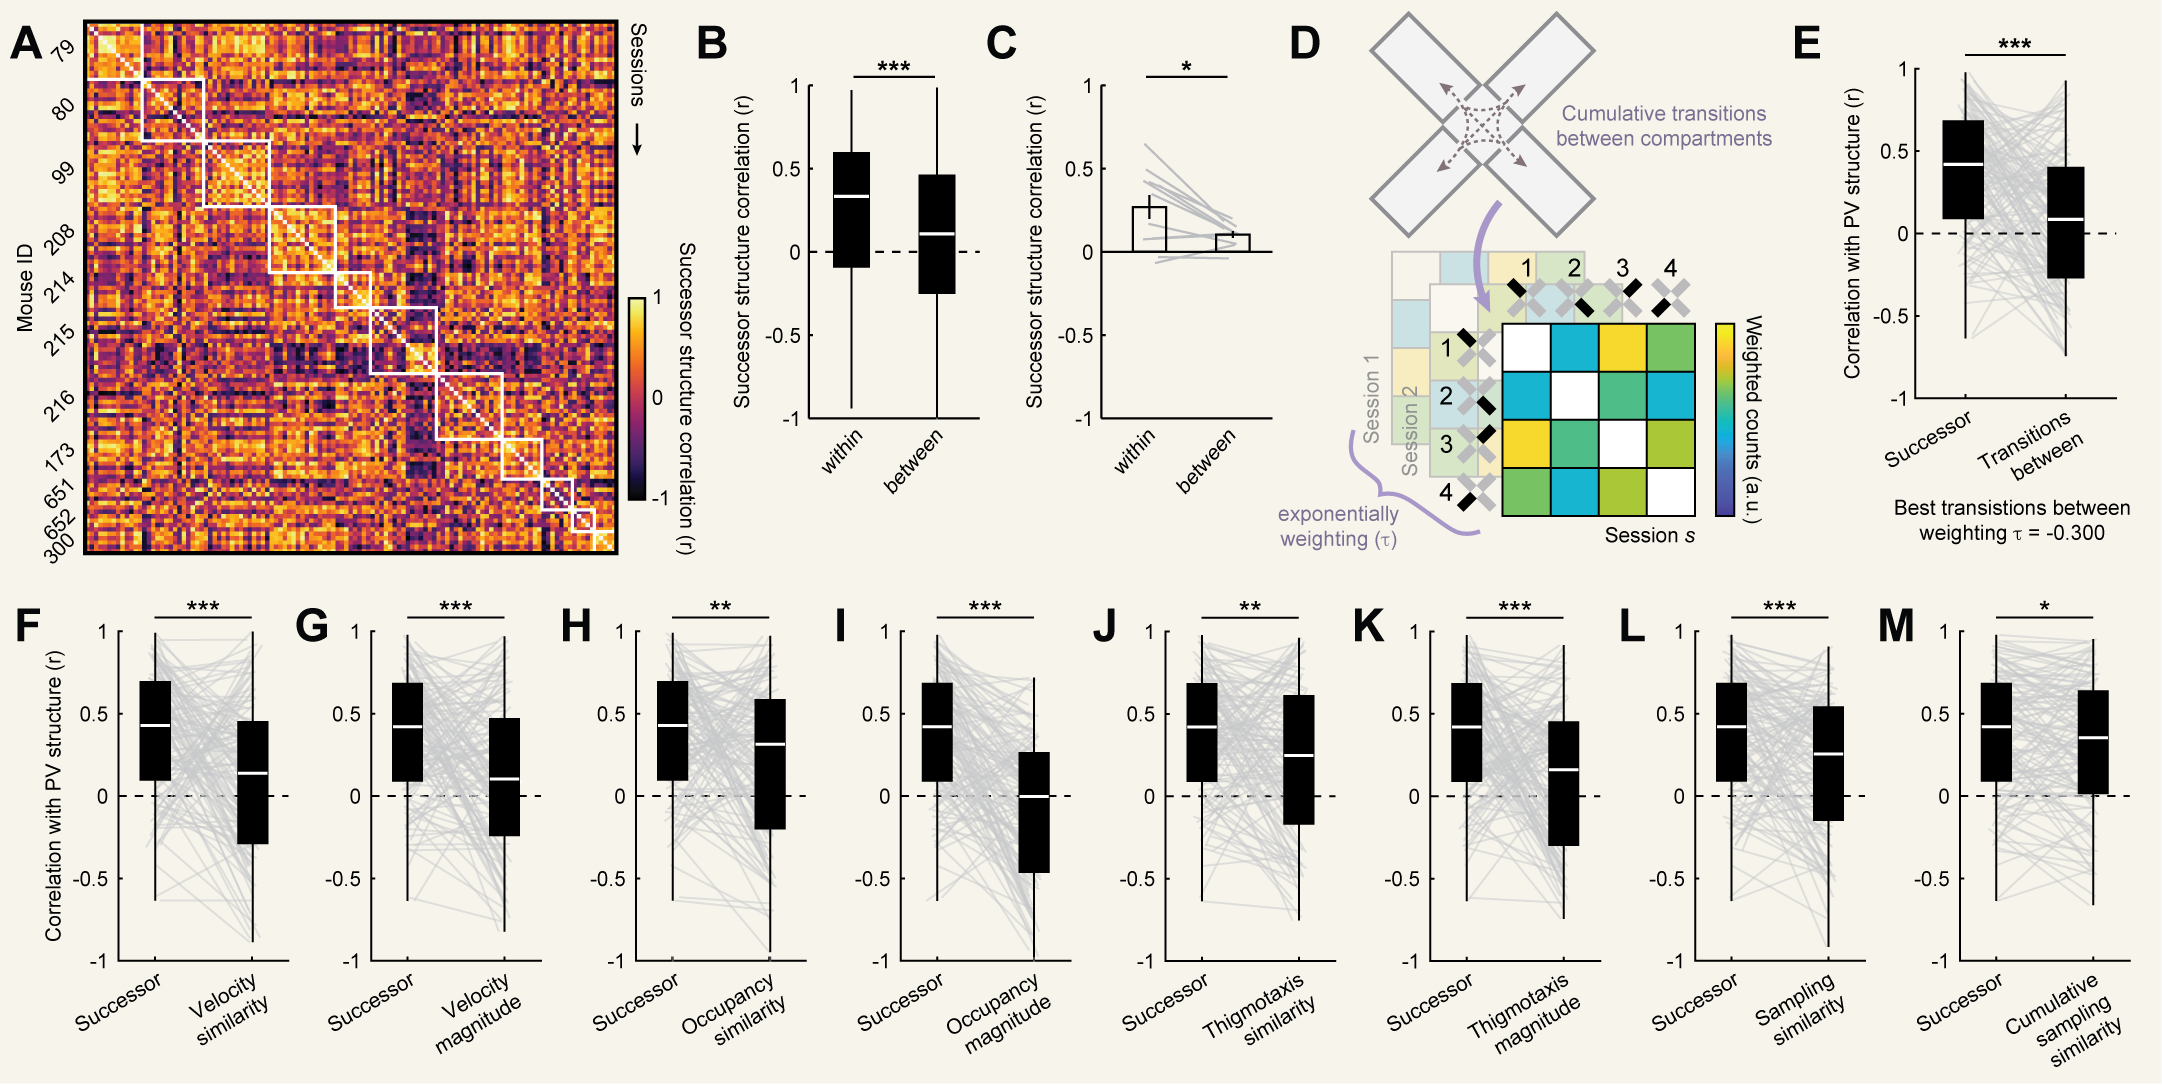
individual session (non-cumulative) successor structures and correlated these structures between sessions [Fig. 4A]. Successor structures were modestly
more correlated within mouse than between mice [Fig. 4B,C], suggesting some consistency in behavioral patterns across sessions within mouse.
However, this varied considerably between mice, with some mice showing little to no consistency in successor structures across sessions. This variability
is useful for distinguishing the relative weightings of cumulative behavior (i.e. $\tau$), as consistent predictive structure across sessions makes it
difficult to parse out the relative contributions of individual sessions. It also suggests that the greater degree of consistency we observe in the CA1
PV structure across sessions is not due to consistent behavior from session to session alone but rather reflects integration of experience across time.
Finally, we asked whether other behavioral determinants might explain CA1 PV structure equally well. We first tested whether transitions between
compartments were equally correlated with PV structure, as might be expected from some instantiations of a predictive theory [21],[49]. To this end,
for each session we computed the cumulative number of transitions between each pair of compartments across all sessions up to and including that
session [Fig. 4D]. As before, it is unclear whether experience during different sessions should be weighted equally. Thus, we weighted the
contributions of each session as in [Eq. 2] and determined the maximizing $\tau$ through a grid search at the same resolution as before (i.e. [Fig. 3B]).
Even at maximizing $\tau$, these matrices were significantly less correlated with PV structures than cumulative successor structures [Fig. 4E].
Next, we asked whether differences in velocity, time spent in each compartment, thigmotaxis, or general sampling patterns could equally account for
PV structure [Fig. S4]. Neither the similarity of velocity measured as the inverse absolute difference between mean velocity in each compartment nor
higher mean velocities could account for PV structure as well as cumulative successor structure [Fig. 4F,G]. Neither the similarity of occupancy
times measured as the inverse absolute difference between total occupancy time in each compartment nor longer mean occupancy times could account
for PV structure as well as cumulative successor structure [Fig. 4H,I]. Neither similar degrees of thigmotaxis measured as the inverse absolute
difference between the proportion of time spent within 5cm of a wall in each compartment nor higher mean degrees of thigmotaxis could account for
PV structure as well as cumulative successor structure [Fig. 4J,K]. Even the similarity of sampling patterns measured as the correlation between
pixel occupancy maps within each compartment could not account for PV structure as well as cumulative successor structure. This was true regardless
of whether we compared only the sampling for a given session or the cumulative sampling for all sessions up to and including that session [Fig. 4L,M].
Together, these results demonstrate that cumulative successor structures uniquely resemble CA1 representational structure, even when compared to other
associated behavioral metrics.
Manipulating navigational options induces reorganization of CA1 representational structure to match the new predictive structure of navigation
Our previous results demonstrate that CA1 exhibits individual differences in the degree of remapping between compartments which coincide with the similarity of predictive structure on a
particular spatiotemporal scale. While these results provide correlational evidence consistent with a predictive theory of cognitive mapping, these theories make a stronger causal claim.
That is, changing the movements of a navigator should induce a corresponding change in representational structure to match the new predictive structure. We next sought to test this prediction.
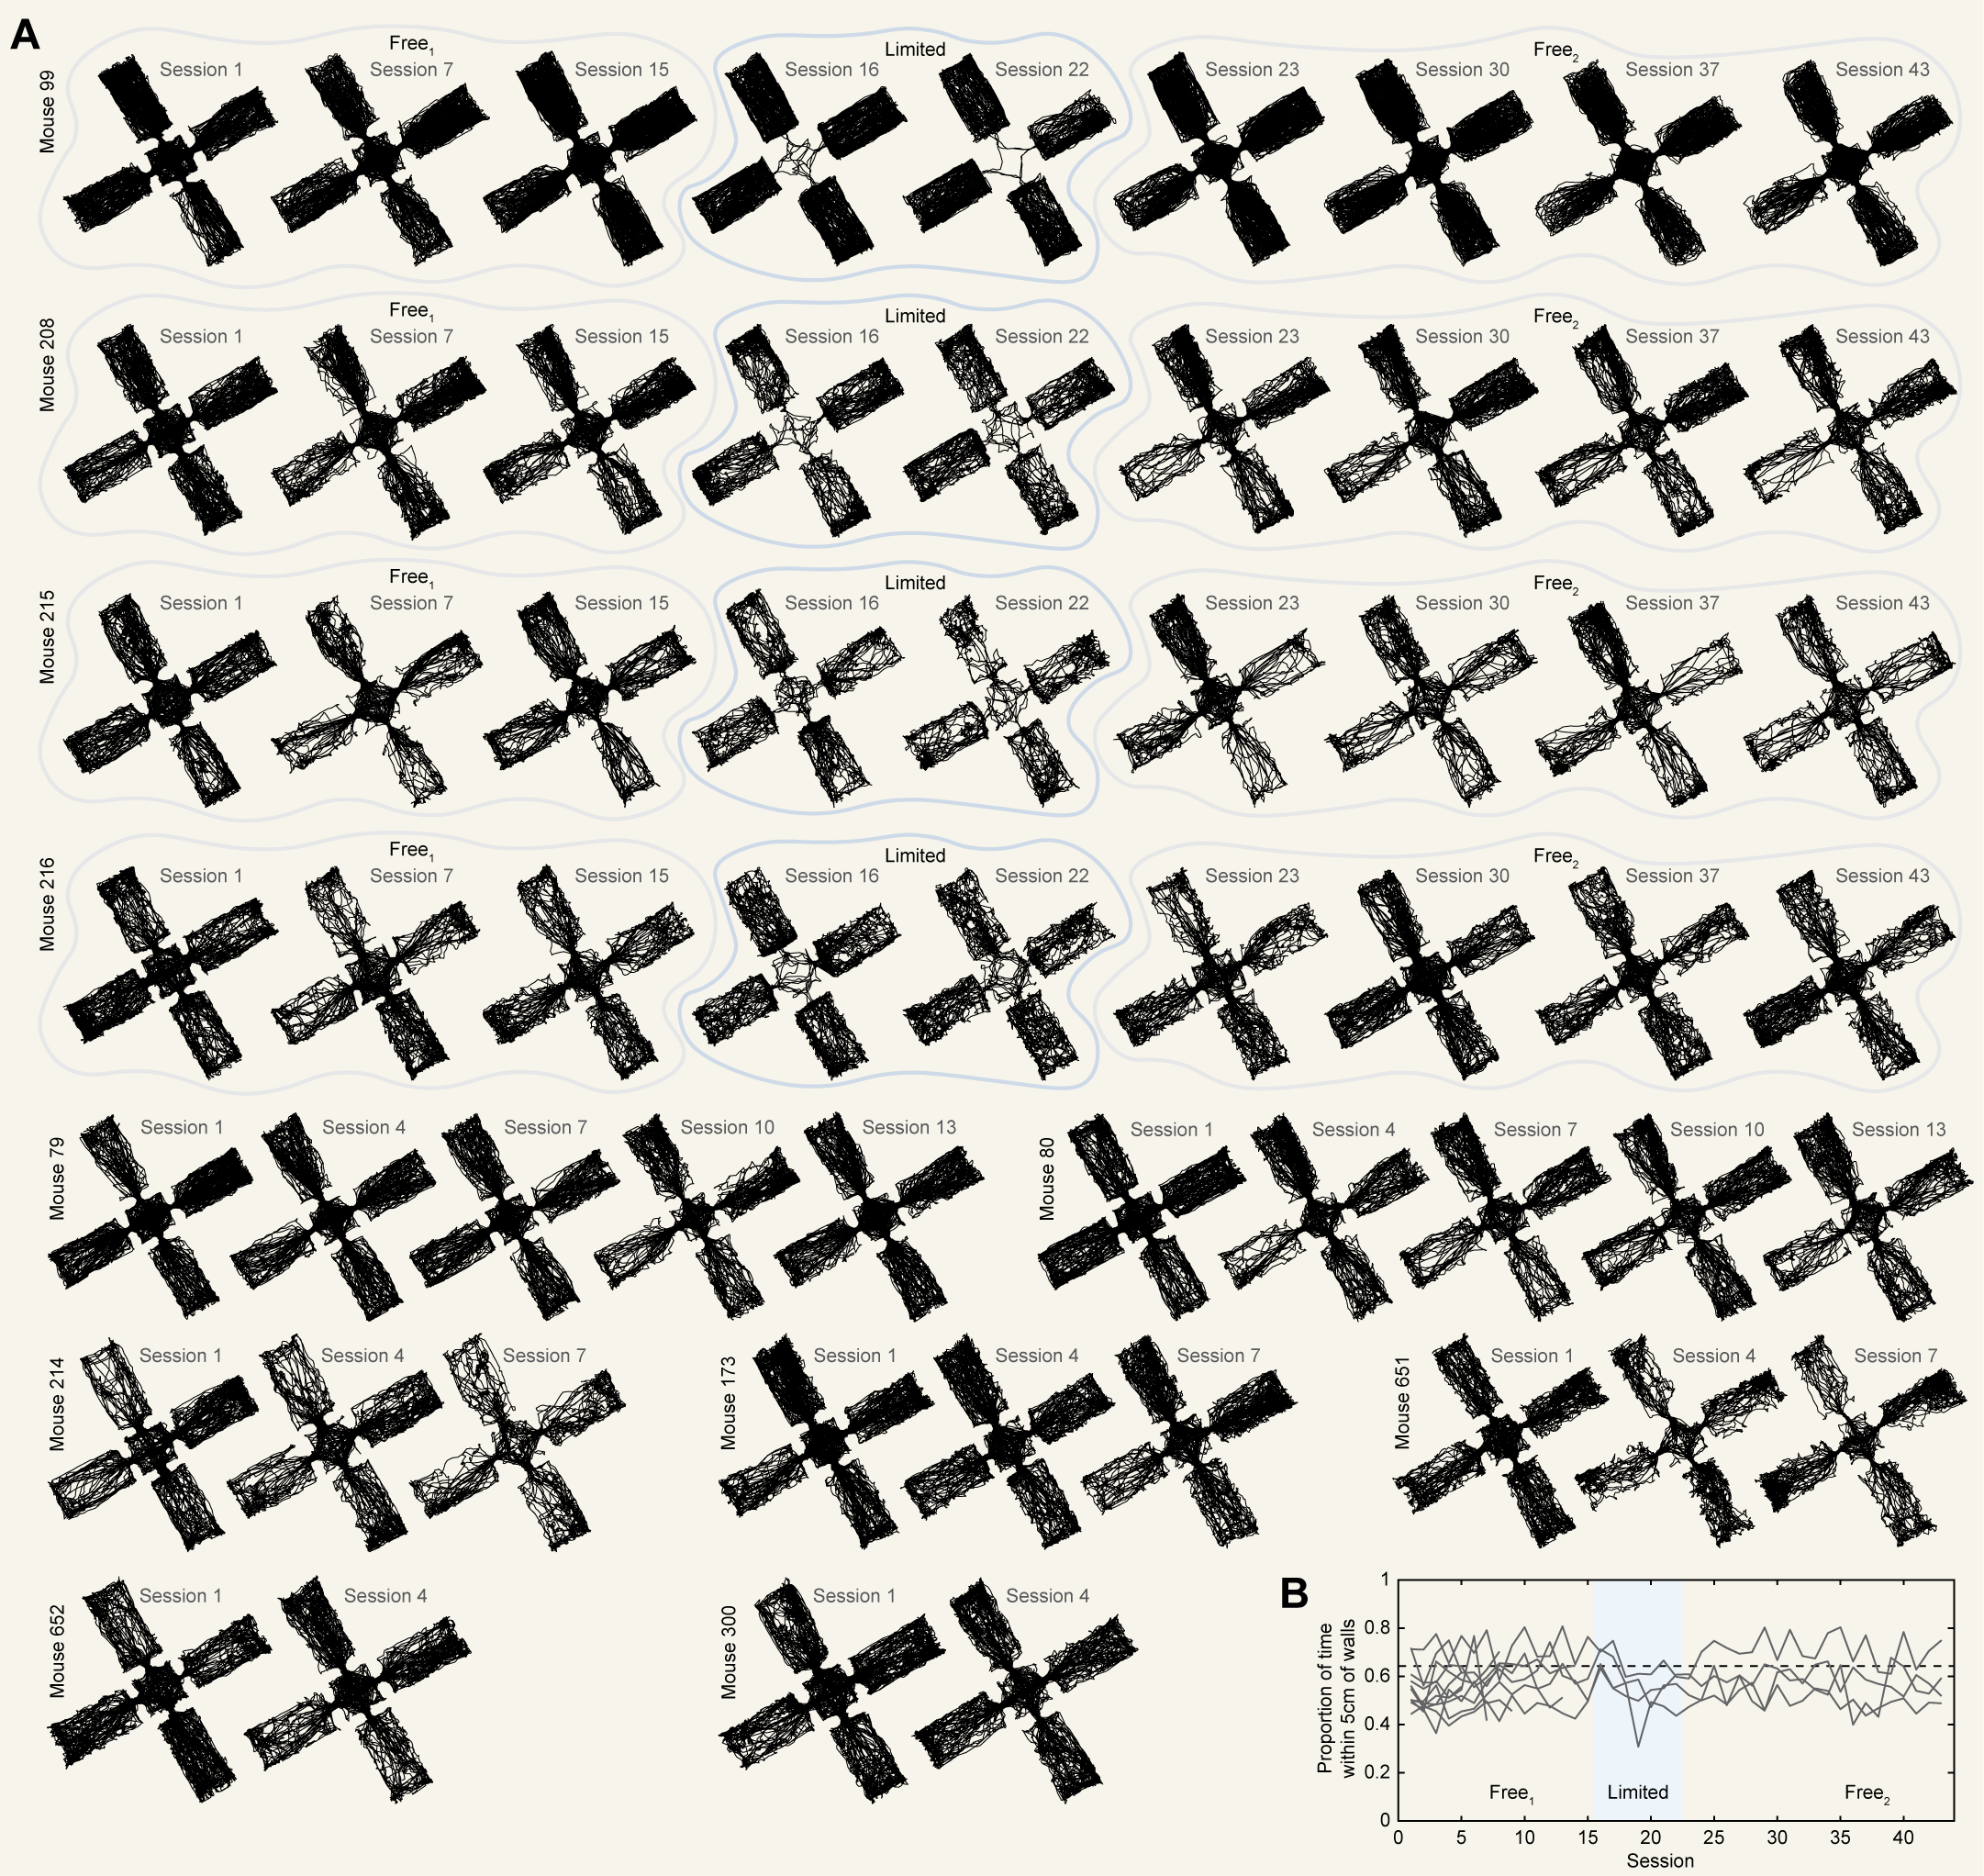
To this end, in four of our mice we followed the initial free navigation phase (15 sessions; $Free^{1}$) with an additional phase of limited navigation (7 sessions; limited) and finally a subsequent
free navigation (21 sessions; $Free^{2}$; Figure S5). During the limited phase, each session consisted of locking the mouse in each compartment for four minutes at a time, twice per session.
Locking was achieved by the experimenter placing a small barrier in the entryway. This barrier was made of the same material as the walls and fit snuggly in the entryway, matching its dimensions.
When each four-minute epoch ended, the door was removed and the mouse freely navigated in clockwise order to the next compartment.
Extensive evidence indicates that manipulating environmental features [39],[40],[45],[46],[47],[58] and
behavioral contingencies [59],[60],[61] can induce remapping in hippocampal CA1. We therefore reasoned that limiting navigational options, a novel experience for the
mouse, would lead to remapping in CA1 during which new predictive structure might be encoded. Moreover, although this manipulation does not enforce a particular change to their navigational trajectories,
free navigation typically involved shorter bouts of exploration within each compartment (median bout duration = $11.13 \pm 4.92$ s; mean $\pm$ standard deviation across $Free^{1}$ sessions). Thus, we
suspected that limiting options would also lead mice to deviate from their free navigational patterns.
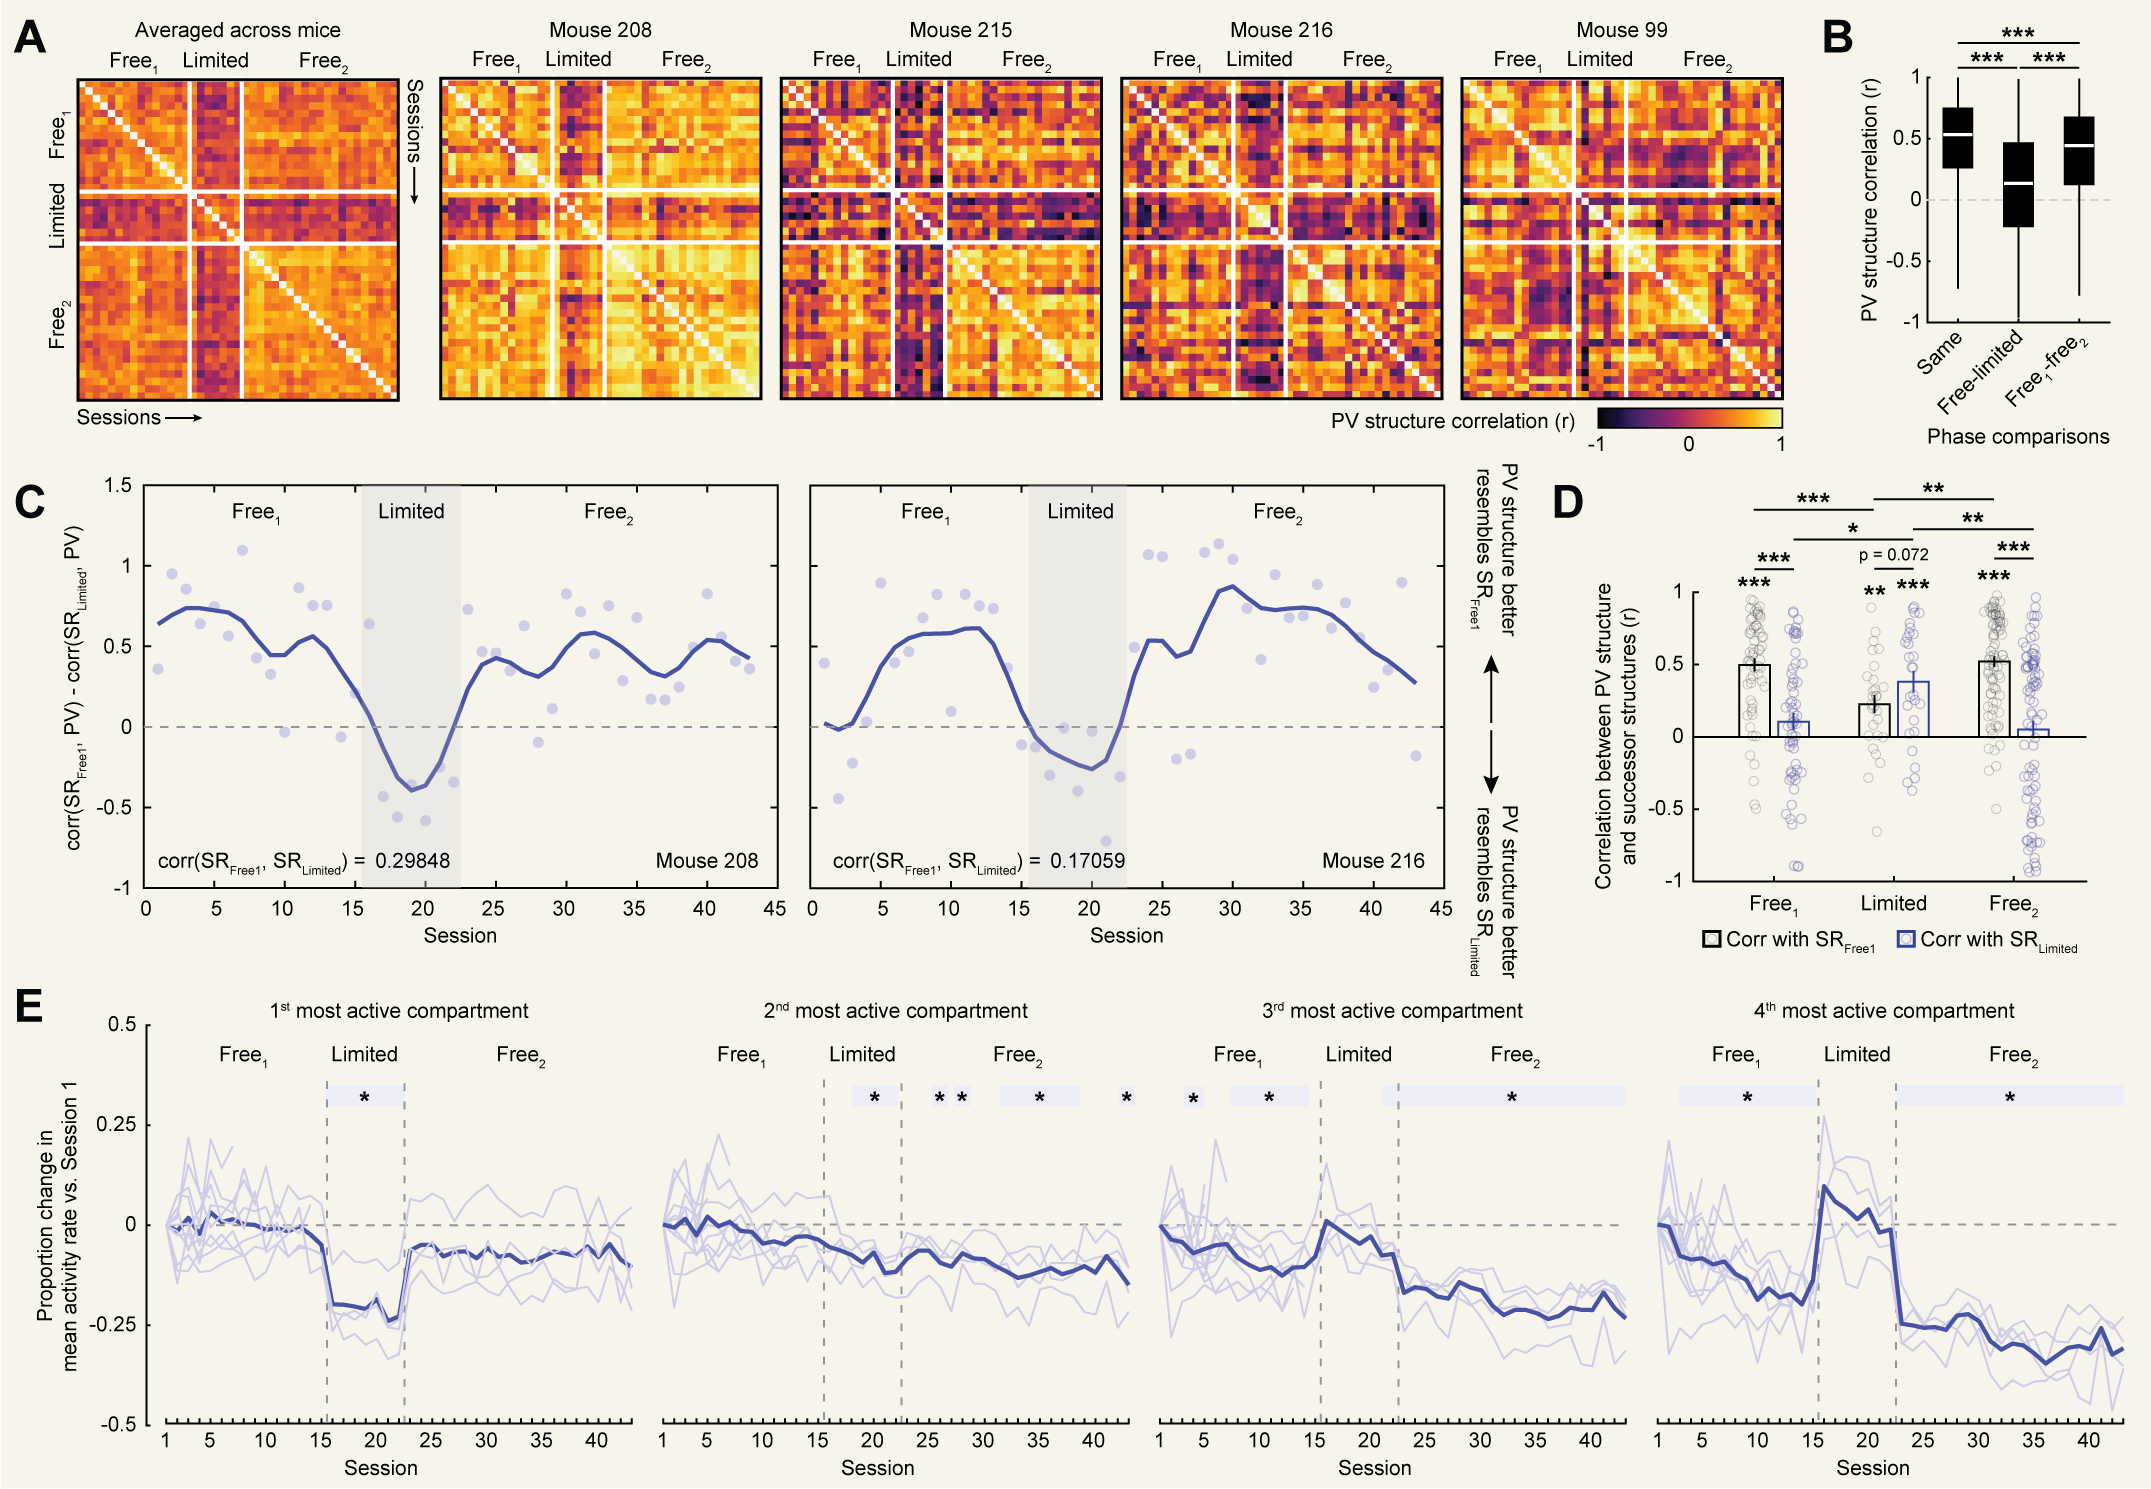
We first confirmed that our manipulation did indeed induce remapping in CA1. To do so, we correlated PV structures across all sessions within each mouse and compared correlations between different phases
of this experiment. Limiting navigational options led to a clear reorganization of PV structure on average and separately in each mouse [Fig. 5A]. Quantifying this, correlations
between free phases and the limited phase were significantly lower than correlations within the same phase (rank sum tests: $Z(1891217) = 19.020$, $p = 1.163e-80$) or between $Free^{1} - Free^{2}$
($Z(926848) = -13.985$, $p = 1.917e-44$; [Fig. 5B]). Correlations between $Free^{1}-Free^{2}$ were numerically high but significantly weaker than same phase correlations
($Z(1874165) = 6.447$, $p = 1.143e-10$). This pattern of results indicates rapid remapping during the limited manipulation, followed by a near return to the initial representational
structure when this manipulation was relaxed.
Given that we observed rapid remapping during the limited phase, we next tested the key hypothesis that patterns of remapping during the limited phase would specifically resemble the new predictive
structure. To do so, for each mouse we computed the mean cumulative successor structure for both $Free^{1}$ and limited navigation phases at the critical spatiotemporal scale determined above
($\gamma = 0.994$ and $\tau = -0.25$). We refer to these mean cumulative successor structures as $SR_{Free1}$ and $SR_{limited}$. These structures were only partially correlated with one another
within each mouse ($r_{99} = 0.699$, $r_{208}=0.299$, $r_{215} = -0.330$, and $r_{216} = 0.171$). We then correlated each of these successor structures with the PV structure for each session and
compared these correlations across phases [Fig. 5C,D]. This analysis revealed that during the $Free^{1}$ phase, PV structures were highly correlated with $SR_{Free1}$ but
uncorrelated with $SR_{limited}$. Crucially, during the limited phase PV structures became correlated with $SR_{limited}$, representing a significant increase over $Free^{1}$ phase correlations.
Correlations with $SR_{limited}$ numerically exceeded those with $SR_{Free1}$, though this difference was statistically marginal. Finally, during $Free^{2}$ the pattern of correlations reverted to that of $Free^{1}$.
These results did not depend on the inclusion of pixels near the entryway in the analysis [Fig. S3]. Together, these results demonstrate that our manipulation specifically induced a
pattern of remapping which matched the new predictive structure at the critical spatiotemporal scale, consistent with a predictive framework. We further note that the rapid reorganization of representational
structure and apparent dissociable encoding of predictive structure during the free and limited phases suggests that other mechanisms, such as remapping of inputs [62],[63], also
interact with the encoding of predictive structure in this paradigm.
Our findings indicate that limiting navigational options led to rapid encoding of new predictive structure while the subsequent return to free navigation prompted a return of the $Free^{1}$ representational structure.
This pattern suggests that the rate of encoding of predictive structure appears to be specific to the experimental phase. Though speculative, we asked whether we could observe other hallmarks of encoding which might
corroborate this possibility. We noted that during $Free^{1}$ activity tended to become sparser over repeated sessions, as reflected by a decrease in the mean activity rate in dispreferred compartments [Fig. 1F].
This decrease roughly matched the optimal weighting of predictive structure across sessions ($\tau = -0.25$). We therefore characterized sparsity across the entire experiment utilizing our full dataset [Fig. 5E].
A linear mixed effects model of changes in activity rate with compartment, session number, and experimental phase as fixed factors and mouse ID as a random factor revealed multiple significant effects and interactions
(significant main effects: session, phase; significant interactions: compartment by session, compartment by phase, compartment by session by phase; Table S2). These reflect that during limited navigation mean activity
rates in dispreferred compartments returned to their initial levels but immediately reverted to their pre-limited rates during the subsequent $Free^{2}$. Qualitatively, mean activity rates in dispreferred compartments decreased
across sessions during the limited phase in a way echoing $Free^{1}$, while $Free^{2}$ resumed the trending decrease from $Free^{1}$. Mean activity rates in the most active compartment also decreased during the limited phase and returned
to their $Free^{1}$ levels during the subsequent $Free^{2}$ phase. Overall, this pattern provides tentative evidence of phase-specific activity changes coinciding with enhanced encoding of predictive structure. Moreover, these findings
suggest that the sparsity of the CA1 representation might serve as a proxy for the rate at which predictive structure is encoded.
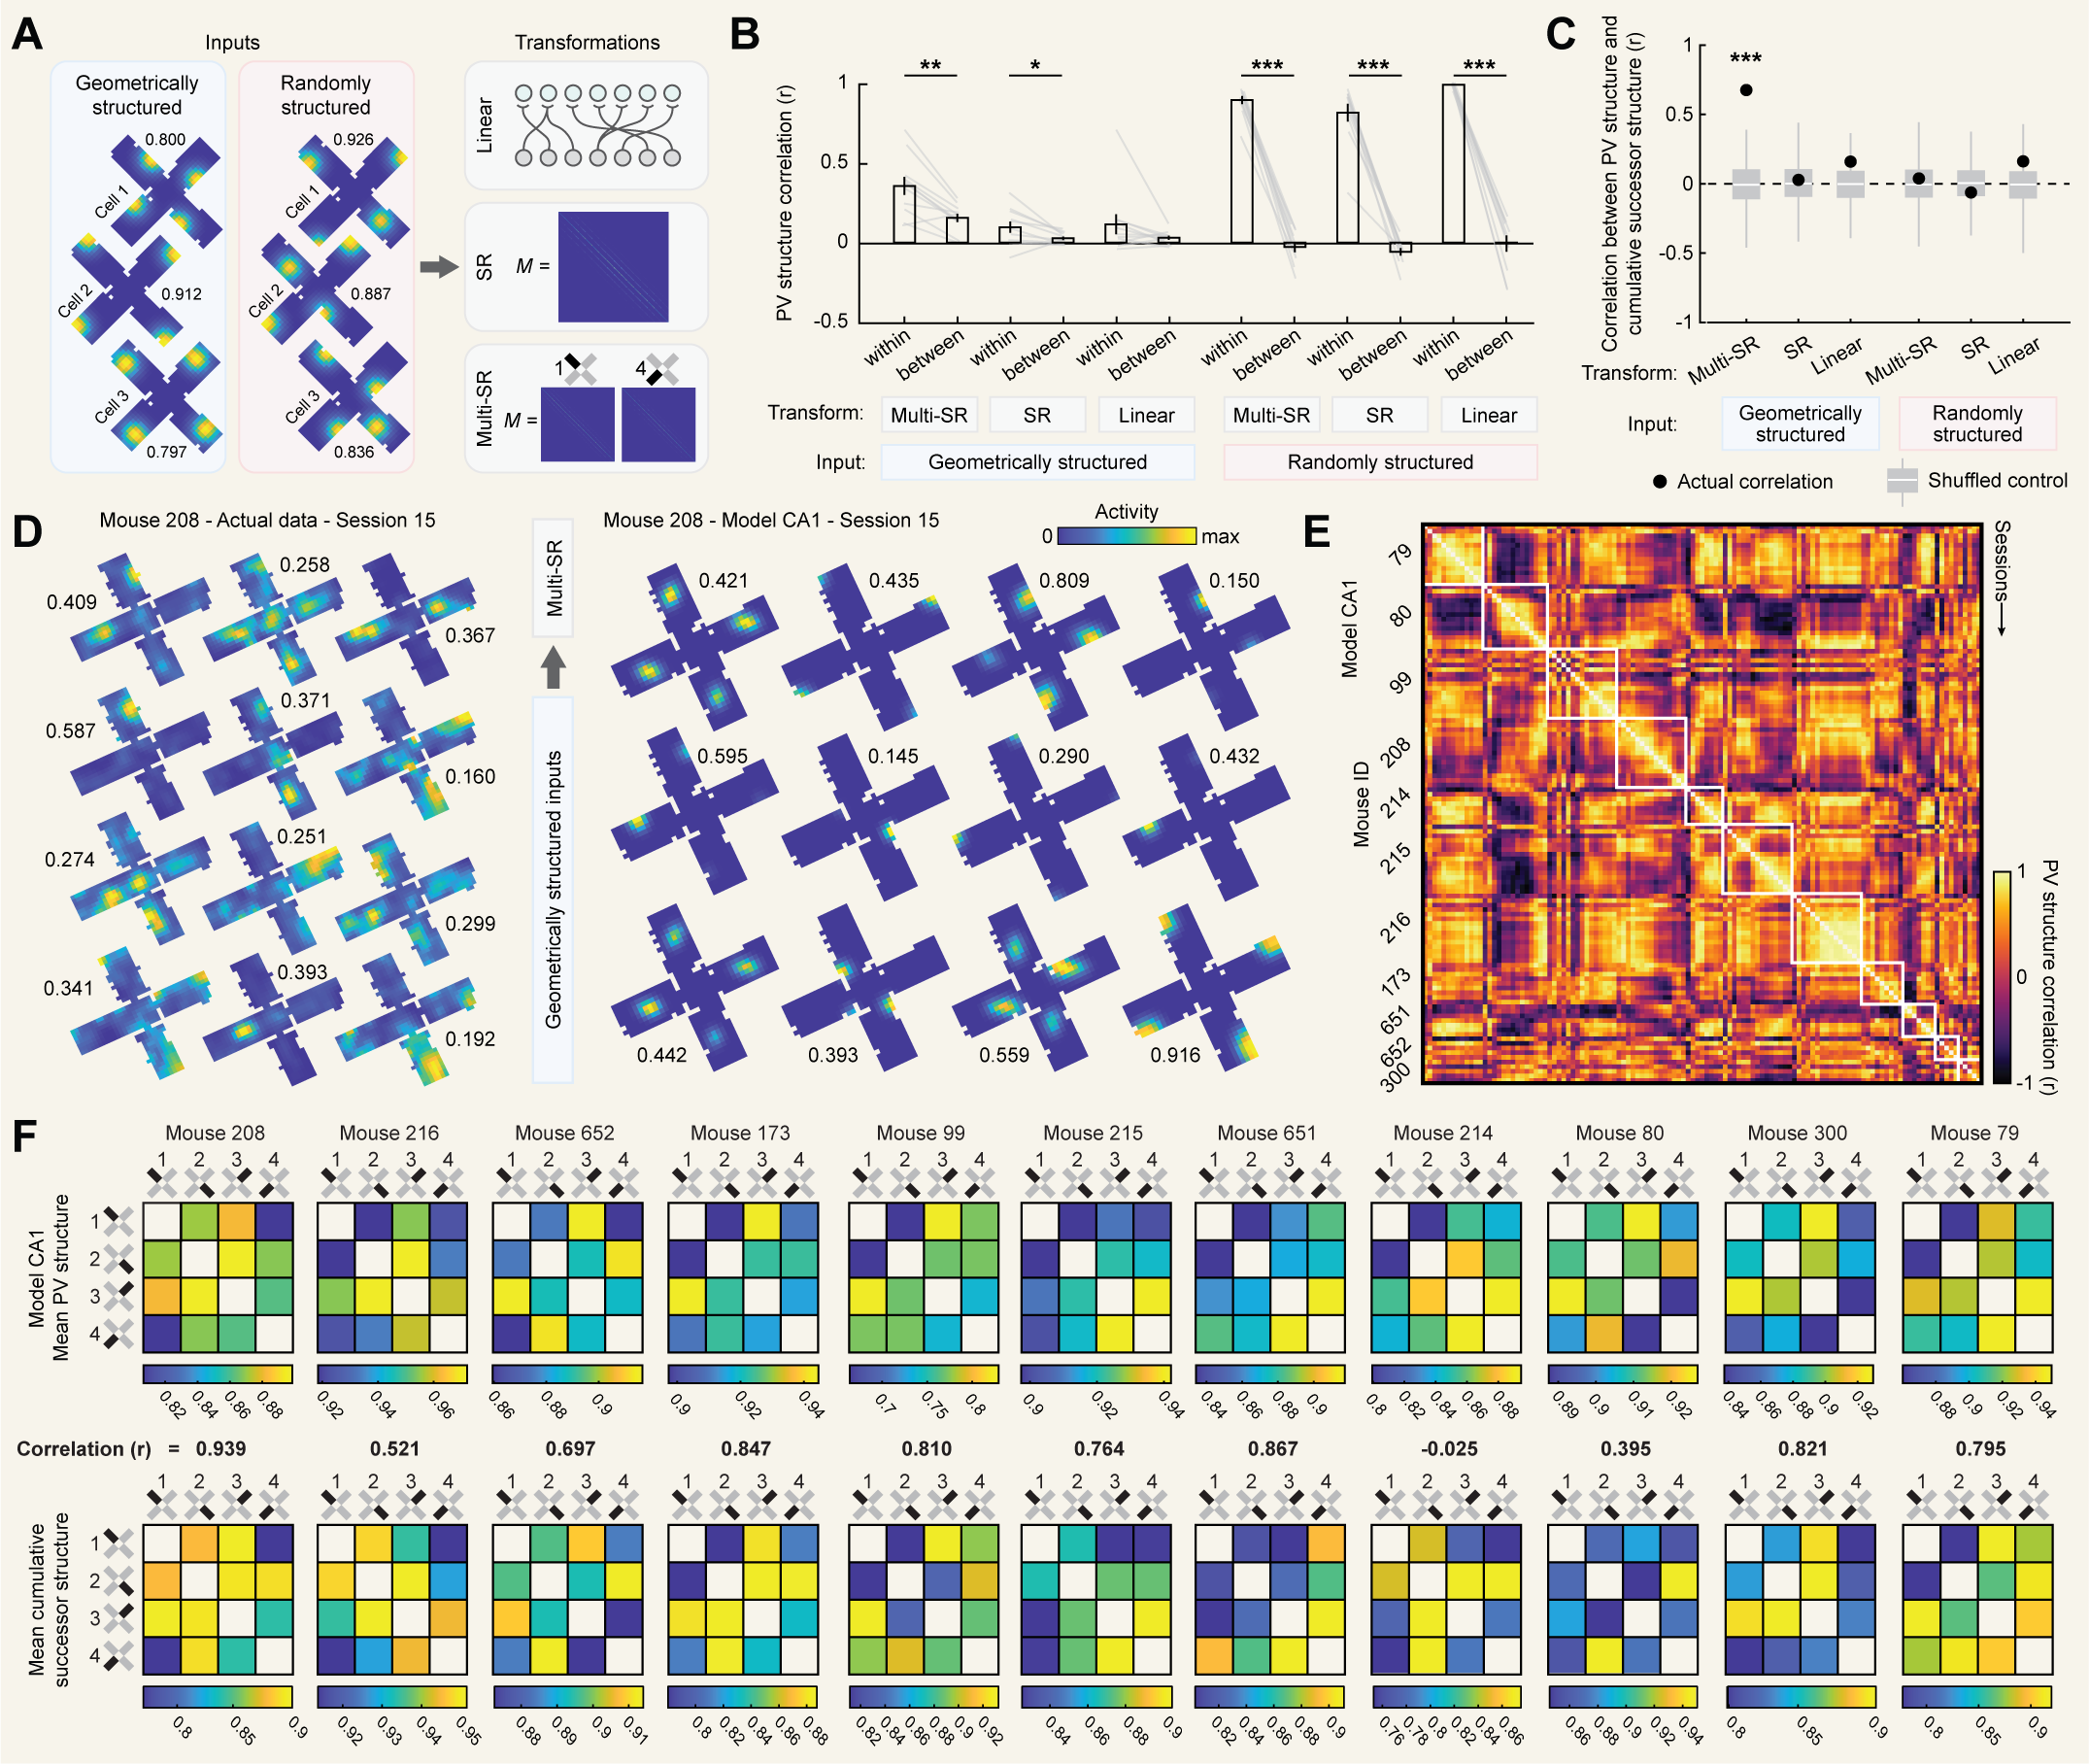
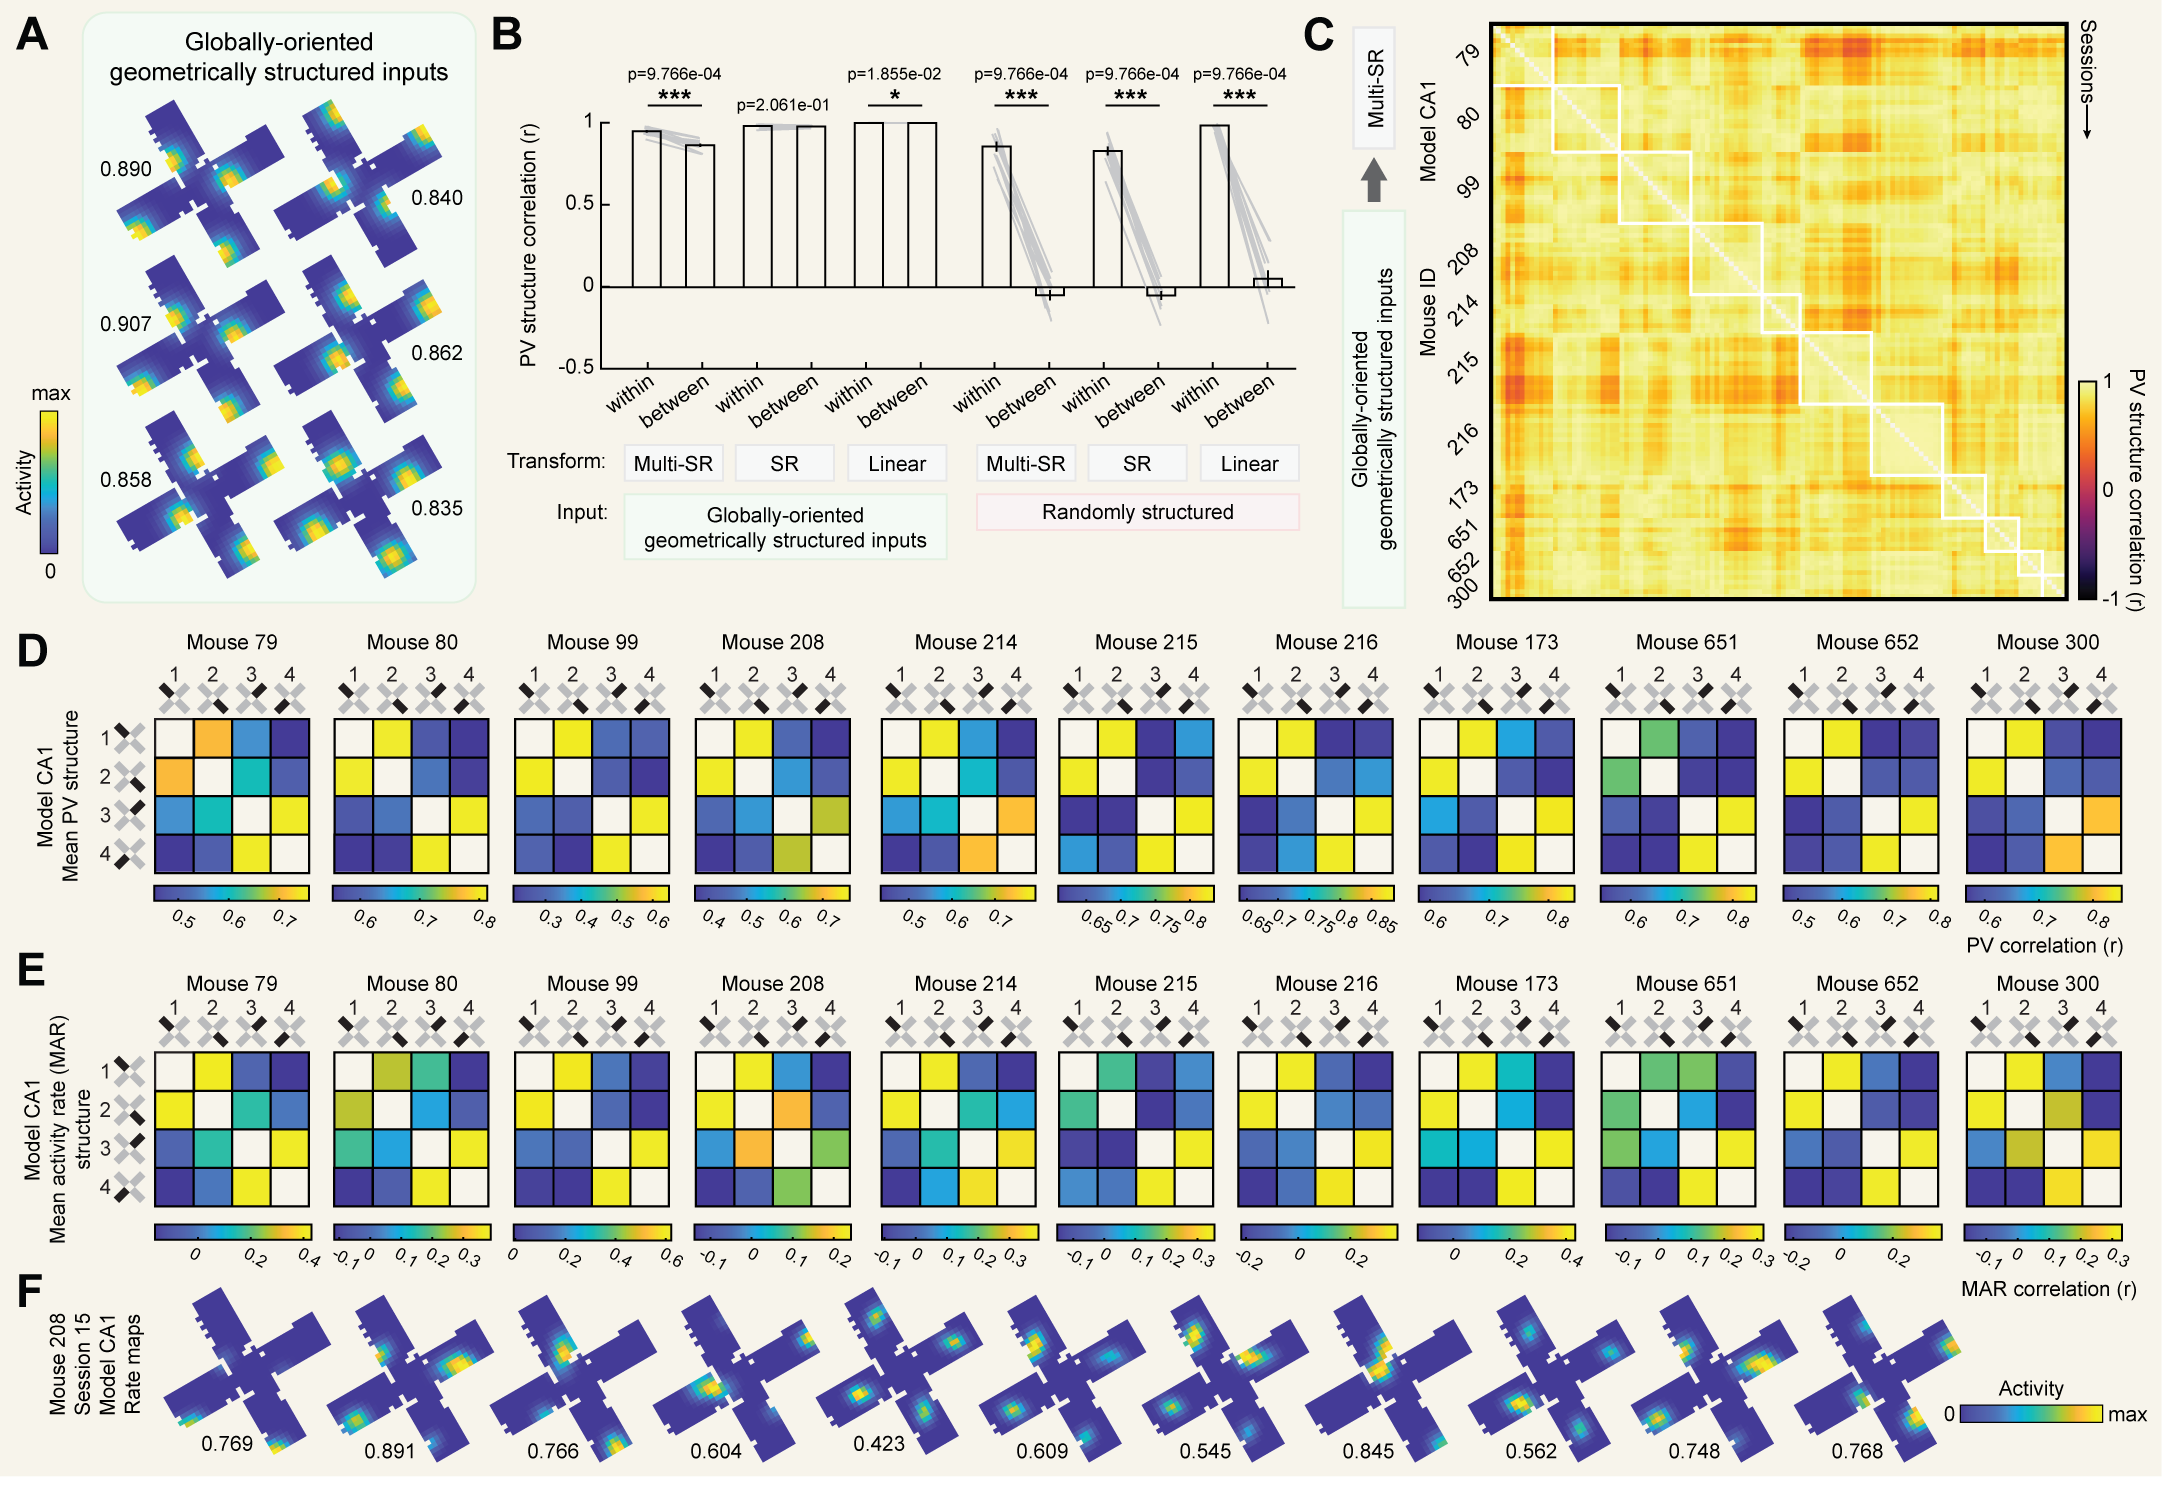
We have shown that in a multicompartment environment CA1 instantiates idiosyncratic patterns of remapping between compartments which are correlated with the similarity of predictive navigational structure on a particular spatiotemporal scale. To gain insight into how this pattern of results might arise, we implemented a series of computational models intended to mimic the input-output transformation carried out by CA1. We varied two aspects of these models: the spatial structure of their inputs and the transformation they compute on these inputs.
We considered inputs with two types of spatial structure. In both cases, inputs consisted of cells tuned to a single preferred location in each compartment. In the case of geometrically structured inputs, the preferred locations were in geometrically identical locations relative to the entryway in each compartment for a given cell [Fig. 6A]. In the case of randomly structured inputs, the preferred location randomly differed between each compartment for a given cell [Fig. 6A]. Contrasting the two will help us infer whether spatial tuning of inputs alone is sufficient to reproduce our results, or whether geometric structure plays an important role.
We also considered three types of transformations. Firstly, we considered a simple linear transformation (linear), where each CA1 cell received a small number of equally weighted inputs (see Methods). Secondly, we considered a predictive transformation (SR) where CA1 learns an approximation of the successor representation over its inputs, as explored previously [26]. In this case, the weight matrix $M$ which determines the strength of the connection from each input cell to each CA1 cell is an online approximation of the successor representation updated at each timestep according to [Eq. 4]:
$M \leftarrow M + \alpha \big[r(t) + \gamma M r(t+1) - M r(t)\big]\, r(t)$
where $r(t)$ is the vector of input firing rates at time $t$, $\gamma$ is the temporal discount factor, and $\alpha$ denotes the learning rate. The total input $F_i$ to each CA1 cell $i$ at each timestep $t$ is then determined by [Eq. 5]:
$F_i = \sum_j M(i,j)\, r_j(t)$
To carry out our simulations, we used the actual navigational trajectories of our mice from the $Free^{1}$ phase of our experiment. For SR and multi-SR simulations, we used $\gamma = 0.994$ corresponding to the maximizing parameterization estimated above. To capture the decreasing weighting of cumulative experience over repeated sessions (i.e. $\tau = -0.25$), the learning rate $\alpha$ was set to decay exponentially at $\tau = -0.25$ from its initial value on session one (initial $\alpha = 0.005$).
For each combination of input structures and transformations we first asked whether we observed reliable individual differences in representational structure, as we observed in our actual data. To this end, for each model we correlated PV structures between all pairwise comparisons of sessions and contrasted comparisons from within the same mouse versus between different mice [Fig. 6B]. We found that all models with randomly structured inputs (which differed from mouse to mouse) recapitulated strong individual differences as indicated by higher correlations for comparisons within mouse than between different mice. On the other hand, geometrically structured inputs (which were identical across mice) did not recapitulate individual differences in every case. Only when these inputs were coupled with learning of predictive structure (i.e. an SR or multi-SR transformation) were significant individual differences observed. These differences were particularly strong when predictive structure was learned separately for each compartment (i.e. multi-SR). These results demonstrate that individual differences are consistent with predictive encoding of geometrically structured inputs, although they may alternatively reflect other between-mouse differences such as randomness in input structure.
Next, for each combination of inputs and transformations we asked whether model PV structures were correlated with cumulative successor structures, as we observed in our actual data. Computing cumulative successor structures at the maximizing parameters ($\gamma = 0.994$, $\tau = -0.25$), we found that PV structures were significantly correlated with cumulative successor structures in only one case: when inputs were geometrically structured and predictive encoding was learned separately for each compartment (multi-SR). Neither factor was on its own sufficient, as other models including only one of these factors failed to produce significant correlations. Interestingly, environment-wide encoding of predictive structure (SR) failed to produce significant correlations even when inputs were geometrically structured. This is because this model encodes only a single predictive structure for the entire environment, and the geometric repetition of inputs across compartments leads the model to learn the average predictive structure across all compartments rather than the predictive structure particular to each compartment.
In sum, among models tested, only a model with geometrically structured inputs and predictive encoding that is learned separately for each compartment can account for both individual differences in PV structure and the correlation between PV structure and successor structure that we observe in our actual data. For completeness, we provide additional visualizations of output from this model [Fig. 6D,E,F]. Alternative models where geometrically structured inputs were embedded in a different orientational reference frame did not replicate these results [Fig. S7], demonstrating that these outcomes also depend on other aspects of input features even for geometrically structured inputs.
Discussion
Here we leveraged miniscope imaging of mouse CA1 in a multicompartment environment to test whether patterns of remapping exhibited hallmarks of predictive structure in a complex environment. We showed that different mice instantiated different patterns of remapping across identically shaped compartments in this paradigm. These patterns coincided with the similarity of predictive navigational structure on a seconds-long timescale, modestly overweighting early experience. Limiting navigational options in this environment induced a new pattern of remapping which specifically matched the new predictive navigational structure on this spatiotemporal scale. Finally, through computational modeling, we show that key results can be accounted for by a specific combination of predictive encoding operating over geometrically structured inputs learned separately within each compartment. Together, these results demonstrate that predictive navigational structure is one important determinant of hippocampal representational structure in complex environments, consistent with predictive theories of cognitive mapping.
In this experiment, we compared patterns of remapping across identical unrewarded compartments from naiveté through extend experience to isolate a potential influence of predictive navigational structure on the hippocampal representation distinct from confounding differences in world features, reward structure, or previous experience. Given that we find evidence of such a determinant under these conditions, we hypothesize that remapping across environments intentionally disambiguated by external cues [38],[43],[45],[46] reflects both differences in input features as well as idiosyncratic navigational differences. Likewise, our results provide evidence that predictive structure is an ongoing determinant of CA1 representational structure even in the absence of external rewards. Thus, we hypothesize that influences of reward structure on hippocampal coding [64],[65],[66] may reflect both differences in rewarding input features as well as differences in goal-directed navigational trajectories. Our findings also suggest that idiosyncratic predictive structure likely contributed to the results of other multicompartment paradigms [41],[49],[54],[55] even when individual differences in representational structure may have been masked by averaging across sessions and animals.
We relied on the successor representation as an operationalization of a predictive theory of hippocampal cognitive mapping [21]. In this model, the hippocampus can be understood as mapping temporally discounted transitions between states of the world, which can be defined not only by location but also extra-spatial features. Indeed, one of the most compelling successes of this model is the ability to make quantitative predictions across scales (single cells, neural populations, behavior), species (rodents, humans), and domains (physical space, visual spaces, conceptual spaces) [21],[67],[68],[69]. Although we characterize transitions between locations as the state-defining feature in this work, we imagine that in practice the CA1 representational structure may be better understood as reflecting transitions among its spatially varying inputs, including those from CA3 and entorhinal cortex [26]. Reflecting this, our modeling demonstrates that both the behavioral history of the navigator and the state-defining inputs play important roles in shaping representational structure in this paradigm, consistent with previous work [26]. Given these findings, we hypothesize that predictive structure also determines CA1 structure when navigating extra-spatial domains embedded in other input feature spaces. Additionally, we note that the successor representation is not the only theory consistent with a predictive determinant of CA1 representational structure [22],[24],[70],[71]. While our results are consistent with the predictions of this model, our experiment was not designed to adjudicate between competing theories of predictive cognitive mapping.
Our results demonstrate that CA1 representational structure most closely matches predictive structure when computed with a seconds-long temporal discount factor and overweighting early sessions. These characteristics are reminiscent of a unique form of hippocampal plasticity known as behavioral timescale synaptic plasticity (BTSP) [72],[73]. BTSP is a mechanism by which new place fields can be endogenously or artificially induced in previously silent CA1 cells by evoking a calcium-mediated plateau potential. Properties of induced place fields indicate that inputs active within a few seconds of this event are potentiated, that these fields exhibit skew which depends on the navigational trajectory during the initial plateau potential, and that endogenous plateau potentials are most common during initial experience [72],[74]. It is thus possible that the predictive determinants of CA1 representational structure we characterize here are a product of BTSP, and more generally that BTSP provides a biological basis for the normative claims of predictive mapping theories. If so, then we would expect to observe an increase in plateau potentials not only in novel environments but also during novel experiences which provoke representational change [75]. Our observations of changes in sparsity within and across experimental phases are roughly consistent with this. However, we interpret this finding with caution due to limitations inherent in our recording technique which do not allow us to distinguish plateau potentials from typical action potentials.
The critical spatiotemporal scale of predictive structure which we characterize here may also depend upon recording location within the hippocampus. It is known that the scale of spatial representations differs along the long dorsoventral axis of the hippocampus, progressing from finely tuned cells in the dorsal hippocampus to coarsely-tuned cells in the ventral [76]. Entorhinal inputs mirror this arrangement [77],[78],[79]. Even if the timescale of plasticity which encodes predictive structure were to be the same across this axis, differences in the scale of inputs might produce differences in the scale of encoded predictive structure [80]. In our work here, all populations were recorded from the dorsal hippocampus. Future work recording from the ventral hippocampus under similar conditions might address this possibility.
Supplementary Figures
Sources
- [1] Tolman, E.C. (1948). Cognitive maps in rats and men. Psychol Rev 55, 189-208. [doi]
- [2] O'Keefe, J., and Nadel, L. (1978). The Hippocampus as a Cognitive Map (Oxford University Press).
- [3] McNaughton, B.L., Battaglia, F.P., Jensen, O., Moser, E.I., and Moser, M.-B. (2006). Path integration and the neural basis of the “cognitive map.” Nat Rev Neurosci 7, 663-678. [doi]
- [4] Peer, M., Brunec, I.K., Newcombe, N.S., and Epstein, R.A. (2021). Structuring Knowledge with Cognitive Maps and Cognitive Graphs. Trends Cogn Sci 25, 37-54. [doi]
- [5] Epstein, R.A., Patai, E.Z., Julian, J.B., and Spiers, H.J. (2017). The cognitive map in humans: spatial navigation and beyond. Nat Neurosci 20, 1504-1513. [doi]
- [6] Poulter, S., Lee, S.A., Dachtler, J., Wills, T.J., and Lever, C. (2021). Vector trace cells in the subiculum of the hippocampal formation. Nat Neurosci 24, 266-275. [doi]
- [7] O'Keefe, J. (1976). Place units in the hippocampus of the freely moving rat. Exp Neurol 51, 78-109.
- [8] O'Keefe, J., and Burgess, N. (1996). Geometric determinants of the place fields of hippocampal neurons. Nature 381, 425-428. [doi]
- [9] Høydal, Ø.A., Skytøen, E.R., Andersson, S.O., Moser, M.-B., and Moser, E.I. (2019). Object-vector coding in the medial entorhinal cortex. Nature 568, 400-404. [doi]
- [10] Deshmukh, S.S., and Knierim, J.J. (2013). Influence of local objects on hippocampal representations: Landmark vectors and memory. Hippocampus 23, 253-267. [doi]
- [11] Knierim, J.J., Neunuebel, J.P., and Deshmukh, S.S. (2014). Functional correlates of the lateral and medial entorhinal cortex: objects, path integration and local-global reference frames. Philosophical Transactions B 369, 20130369. [doi]
- [12] Sargolini, F., Fyhn, M., Hafting, T., McNaughton, B.L., Witter, M.P., Moser, M.-B., and Moser, E.I. (2006). Conjunctive representation of position, direction, and velocity in entorhinal cortex. Science 312, 758-762. [doi]
- [13] Hafting, T., Fyhn, M., Molden, S., Moser, M.-B., and Moser, E.I. (2005). Microstructure of a spatial map in the entorhinal cortex. Nature 436, 801-806. [doi]
- [14] Lever, C., Burton, S., Jeewajee, A., O'Keefe, J., and Burgess, N. (2009). Boundary Vector Cells in the Subiculum. J Neurosci 29, 9771-9777. [doi]
- [15] Ormond, J., and O'Keefe, J. (2022). Hippocampal place cells have goal-oriented vector fields. Nature 607, 741-746. [doi]
- [16] Barry, C., Lever, C., Hayman, R., Hartley, T., Burton, S., O'Keefe, J., Jeffery, K., and Burgess, N. (2006). The boundary vector cell model. Rev Neurosci 17, 71-97.
- [17] Zhou, Y.-Q., Puliyadi, V., Chen, X., Lee, J.L., Zhang, L.-Y., and Knierim, J.J. (2024). Vector coding and place coding share a directional signal. Nat Commun 15, 10630. [doi]
- [18] Taube, J.S., and Burton, H.L. (1995). Head direction cell activity in novel environments. J Neurophysiol 74, 1953-1971.
- [19] Taube, J.S. (1995). Head direction cells in anterior thalamus. J Neurosci 15, 70-86.
- [20] Solstad, T., Boccara, C.N., Kropff, E., Moser, M.-B., and Moser, E.I. (2008). Representation of geometric borders. Science 322, 1865-1868. [doi]
- [21] Stachenfeld, K.L., Botvinick, M.M., and Gershman, S.J. (2017). The hippocampus as a predictive map. Nat Neurosci 20, 1643-1653. [doi]
- [22] George, D., Rikhye, R. V., Gothoskar, N., Guntupalli, J.S., Dedieu, A., and Lázaro-Gredilla, M. (2021). Clone-structured graph representations. Nat Commun 12, 2392. [doi]
- [23] Whittington, J.C.R., Muller, T.H., Mark, S., Chen, G., Barry, C., Burgess, N., and Behrens, T.E.J. (2020). The Tolman-Eichenbaum Machine. Cell 183, 1249-1263.e23. [doi]
- [24] Levenstein, D., Efremov, A., Eyono, R.H., Peyrache, A., and Richards, B. (2024). Sequential predictive learning. Preprint. [doi]
- [25] Chandra, S., Sharma, S., Chaudhuri, R., and Fiete, I. (2025). Episodic and associative memory from spatial scaffolds. Nature 638, 739-751. [doi]
- [26] de Cothi, W., and Barry, C. (2020). Neurobiological successor features. Hippocampus 30, 1347-1355. [doi]
- [27] Bennett, L., de Cothi, W., Muessig, L., Rodrigues, F.R., Cacucci, F., Wills, T.J., Sun, Y., Giocomo, L.M., Lever, C., Poulter, S., et al. (2024). Unifying Subicular Function. bioRxiv. [doi]
- [28] Derdikman, D., Whitlock, J.R., Tsao, A., Fyhn, M., Hafting, T., Moser, M.-B., and Moser, E.I. (2009). Fragmentation of grid cell maps. Nat Neurosci 12, 1325-1332. [doi]
- [29] Keinath, A.T., Epstein, R.A., and Balasubramanian, V. (2018). Environmental deformations. Elife 7. [doi]
- [30] Moore, J.J., Cushman, J.D., Acharya, L., Popeney, B., and Mehta, M.R. (2021). Linking multiplexed tuning, plasticity and navigation. Nature 599, 442-448. [doi]
- [31] Zutshi, I., Apostolelli, A., Yang, W., Zheng, Z.S., Dohi, T., Balzani, E., Williams, A.H., Savin, C., and Buzsáki, G. (2025). Hippocampal activity aligned with action plans. Nature 639, 153-161. [doi]
- [32] Nieh, E.H., Schottdorf, M., Freeman, N.W., Low, R.J., Lewallen, S., Koay, S.A., Pinto, L., Gauthier, J.L., Brody, C.D., and Tank, D.W. (2021). Geometry of abstract knowledge. Nature 595, 80-84. [doi]
- [33] Climer, J.R., Davoudi, H., Oh, J.Y., and Dombeck, D.A. (2025). Hippocampal representations drift. Nature. [doi]
- [34] Hardcastle, K., Maheswaranathan, N., Ganguli, S., and Giocomo, L.M. (2017). A multiplexed, adaptive code. Neuron 94, 375-387.e7. [doi]
- [35] Liberti, W.A., Schmid, T.A., Forli, A., Snyder, M., and Yartsev, M.M. (2022). Stable hippocampal code in flying bats. Nature 604, 98-103. [doi]
- [36] Wiener, S.I., Paul, C.A., and Eichenbaum, H. (1989). Spatial and behavioral correlates. J Neurosci 9, 2737-2763. [doi]
- [37] Sun, C., Yang, W., Martin, J., and Tonegawa, S. (2020). Transferable event units. Nat Neurosci 23, 651-663. [doi]
- [38] Leutgeb, S., Leutgeb, J.K., Barnes, C.A., Moser, E.I., McNaughton, B.L., and Moser, M.-B. (2005). Independent codes for spatial and episodic memory. Science 309, 619-623. [doi]
- [39] Bostock, E., Muller, R.U., and Kubie, J.L. (1991). Experience-dependent modifications. Hippocampus 1, 193-205. [doi]
- [40] Jeffery, K.J., and Anderson, M.I. (2003). Dissociation of geometric and contextual influences. Hippocampus 13, 868-872. [doi]
- [41] Fuhs, M.C., Vanrhoads, S.R., Casale, A.E., McNaughton, B., and Touretzky, D.S. (2005). Path integration vs orientation. J Neurophysiol 94, 2603-2616. [doi]
- [42] Tanni, S., de Cothi, W., and Barry, C. (2022). State transitions in place cell populations. Curr Biol 32, 3505-3514.e7. [doi]
- [43] Bostock, E., Muller, R.U., and Kubie, J.L. (1991). Experience-dependent modifications. Hippocampus 1, 193-205. [doi]
- [44] Lever, C., Wills, T., Cacucci, F., Burgess, N., and O'Keefe, J. (2002). Long-term plasticity. Nature 416, 90-94. [doi]
- [45] Colgin, L.L., Leutgeb, S., Jezek, K., Leutgeb, J.K., Moser, E.I., McNaughton, B.L., and Moser, M.-B. (2010). Attractor-map vs autoassociation dynamics. J Neurophysiol 104, 35-50. [doi]
- [46] Wills, T.J., Lever, C., Cacucci, F., Burgess, N., and O'Keefe, J. (2005). Attractor dynamics in local environment representation. Science 308, 873-876. [doi]
- [47] Plitt, M.H., and Giocomo, L.M. (2021). Experience-dependent contextual codes. Nat Neurosci 24, 705-714. [doi]
- [48] Nilchian, P., Wilson, M.A., and Sanders, H. (2022). Animal-to-animal variability in remapping. J Neurosci 42, 5268-5280. [doi]
- [49] Duvelle, É., Grieves, R.M., Liu, A., Jedidi-Ayoub, S., Holeniewska, J., Harris, A., Nyberg, N., Donnarumma, F., Lefort, J.M., Jeffery, K.J., et al. (2021). Place cells encode global location. Curr Biol 31, 1221-1233.e9. [doi]
- [50] Pnevmatikakis, E.A., and Giovannucci, A. (2017). NoRMCorre motion correction. J Neurosci Methods 291, 83-94. [doi]
- [51] Pnevmatikakis, E.A., Soudry, D., Gao, Y., Machado, T.A., Merel, J., Pfau, D., Reardon, T., Mu, Y., Lacefield, C., Yang, W., et al. (2016). Denoising, deconvolution, and demixing. Neuron 89, 285-299. [doi]
- [52] Zhou, P., Resendez, S.L., Rodriguez-Romaguera, J., Jimenez, J.C., Neufeld, S.Q., Giovannucci, A., Friedrich, J., Pnevmatikakis, E.A., Stuber, G.D., Hen, R., et al. (2018). Extraction of calcium signals. Elife 7. [doi]
- [53] Friedrich, J., Zhou, P., and Paninski, L. (2017). Fast online deconvolution. PLoS Comput Biol 13, e1005423. [doi]
- [54] Spiers, H.J., Hayman, R.M.A., Jovalekic, A., Marozzi, E., and Jeffery, K.J. (2015). Place field repetition. Cereb Cortex 25, 10-25. [doi]
- [55] Grieves, R.M., Jenkins, B.W., Harland, B.C., Wood, E.R., and Dudchenko, P.A. (2016). Place field repetition and learning. Hippocampus 26, 118-134. [doi]
- [56] Karlsson, M.P., and Frank, L.M. (2008). Sparse, informative representations. J Neurosci 28, 14271-14281. [doi]
- [57] Fenton, A.A. (2024). Remapping revisited. Nat Rev Neurosci 25, 428-448. [doi]
- [58] Anderson, M.I., and Jeffery, K.J. (2003). Heterogeneous modulation of place cells. J Neurosci 23, 8827-8835.
- [59] Krishnan, S., Heer, C., Cherian, C., and Sheffield, M.E.J. (2022). Reward expectation extinction. Nat Commun 13, 6662. [doi]
- [60] Sosa, M., Plitt, M.H., and Giocomo, L.M. (2025). Flexible population code for reward. Nat Neurosci 28, 1497-1509. [doi]
- [61] Pettit, N.L., Yuan, X.C., and Harvey, C.D. (2022). Place codes gated by engagement. Nat Neurosci 25, 561-566. [doi]
- [62] Lykken, C.M., Kanter, B.R., Nagelhus, A., Carpenter, J., Guardamagna, M., Moser, E.I., and Moser, M.-B. (2025). Functional independence of grid modules. Preprint. [doi]
- [63] Fyhn, M., Hafting, T., Treves, A., Moser, M.-B., and Moser, E.I. (2007). Grid realignment. Nature 446, 190-194. [doi]
- [64] Jarzebowski, P., Hay, Y.A., Grewe, B.F., and Paulsen, O. (2022). Reward location encoding. Curr Biol 32, 834-841.e5. [doi]
- [65] Sato, M., Mizuta, K., Islam, T., Kawano, M., Sekine, Y., Takekawa, T., Gomez-Dominguez, D., Schmidt, A., Wolf, F., Kim, K., et al. (2020). Over-representation of landmarks and rewards. Cell Rep 32, 107864. [doi]
- [66] Gauthier, J.L., and Tank, D.W. (2018). Dedicated reward population. Neuron 99, 179-193.e7. [doi]
- [67] Momennejad, I., Russek, E.M., Cheong, J.H., Botvinick, M.M., Daw, N.D., and Gershman, S.J. (2017). Successor representation in human RL. Nat Hum Behav 1, 680-692. [doi]
- [68] de Cothi, W., Nyberg, N., Griesbauer, E.-M., Ghanamé, C., Zisch, F., Lefort, J.M., Fletcher, L., Newton, C., Renaudineau, S., Bendor, D., et al. (2022). Predictive maps in rats and humans. Curr Biol 32, 3676-3689.e5. [doi]
- [69] Garvert, M.M., Saanum, T., Schulz, E., Schuck, N.W., and Doeller, C.F. (2023). Spatio-predictive cognitive maps. Nat Neurosci 26, 615-626. [doi]
- [70] Savelli, F., and Knierim, J.J. (2019). Origin and role of path integration. J Exp Biol 222. [doi]
- [71] Zutshi, I., Apostolelli, A., Yang, W., Zheng, Z., Dohi, T., Balzani, E., Williams, A.H., Savin, C., and Buzsáki, G. (2024). Activity aligned with action plans. Preprint. [doi]
- [72] Bittner, K.C., Milstein, A.D., Grienberger, C., Romani, S., and Magee, J.C. (2017). BTSP underlies CA1 place fields. Science 357, 1033-1036. [doi]
- [73] Milstein, A.D., Li, Y., Bittner, K.C., Grienberger, C., Soltesz, I., Magee, J.C., and Romani, S. (2021). Bidirectional plasticity. Elife 10. [doi]
- [74] Madar, A.D., Dong, C., and Sheffield, M.E.J. (2023). BTSP, not STDP, drives representation shifts. bioRxiv. [doi]
- [75] Monaco, J.D., Rao, G., Roth, E.D., and Knierim, J.J. (2014). Attentive scanning drives one-trial potentiation. Nat Neurosci 17, 725-731. [doi]
- [76] Kjelstrup, K.B., Solstad, T., Brun, V.H., Hafting, T., Leutgeb, S., Witter, M.P., Moser, E.I., and Moser, M.-B. (2008). Finite scale of spatial representation. Science 321, 140-143. [doi]
- [77] Brun, V.H., Solstad, T., Kjelstrup, K.B., Fyhn, M., Witter, M.P., Moser, E.I., and Moser, M.B. (2008). Progressive increase in grid scale. Hippocampus 18, 1200-1212. [doi]
- [78] Stensola, H., Stensola, T., Solstad, T., Frøland, K., Moser, M.-B., and Moser, E.I. (2012). Discretized grid map. Nature 492, 72-78. [doi]
- [79] Giocomo, L.M., Stensola, T., Bonnevie, T., Van Cauter, T., Moser, M.-B., and Moser, E.I. (2014). Topography of head direction cells. Curr Biol 24, 252-262. [doi]
- [80] Momennejad, I., and Howard, M.W. (2018). Multi-scale successor representations. Preprint. [doi]
- [81] Pnevmatikakis, E.A., and Giovannucci, A. (2017). NoRMCorre motion correction. J Neurosci Methods 291, 83-94. [doi]
- [82] Pnevmatikakis, E.A., Soudry, D., Gao, Y., Machado, T.A., Merel, J., Pfau, D., Reardon, T., Mu, Y., Lacefield, C., Yang, W., et al. (2016). Denoising, deconvolution, and demixing. Neuron 89, 285-299. [doi]
- [83] Mathis, A., Mamidanna, P., Cury, K.M., Abe, T., Murthy, V.N., Mathis, M.W., and Bethge, M. (2018). DeepLabCut. Nat Neurosci 21, 1281-1289. [doi]
- [84] Skaggs, W.E., McNaughton, B.L., and Gothard, K.M. (1993). Information-theoretic approach to hippocampal code. NIPS, 1030-1037.
- [85] McKenzie, S., Huszár, R., English, D.F., Kim, K., Christensen, F., Yoon, E., and Buzsáki, G. (2021). Preexisting network dynamics constrain induced place fields. Neuron 109, 1040-1054.e7. [doi]
← Back to Blog | Home